Students should go through these JAC Class 9 Maths Notes Chapter 4 Linear Equations in Two Variables will seemingly help to get a clear insight into all the important concepts.
JAC Board Class 9 Maths Notes Chapter 4 Linear Equations in Two Variables
Linear Equation In One Variable:
An equation of the form ax + b = 0, where a and bare real numbers with a = 0 and ‘x’ is a variable, is called a linear equation in one variable.
Here ‘a’ is called coefficient of x and ‘b’ is called a constant term. i.e. 3x + 5 = 0, 7x – 2 = 0 etc.
Linear Equation In Two Variables:
An equation of the form ax + by + c = 0 where a, b, c are real numbers and a and b both are not to be zero, and x, y are variables, is called a linear equation in two variables, here ‘a’ is called coefficient of x, ‘b’ is called coefficient of y and ‘c’ is called constant term.
Any pair of values of x and y which satisfies the equation ax + by + c = 0, is called a solution of it.
Graph Of A Linear Equation:
→ In order to draw the graph of a linear equation in one variable we may follow the following algorithm.
Step I: Obtain the linear equation.
Step II: If the equation is of the form ax = b, a ≠ 0, then plot the point \(\left(\frac{\mathrm{b}}{\mathrm{a}}, 0\right)\) and one more point \(\left(\frac{b}{a}, \alpha\right)\) where α is any real number. If the equation is of the form ay = b, a ≠ 0, then plot the point \(\left(0, \frac{b}{a}\right)\) and \(\left(\beta, \frac{b}{a}\right)\) where β is any real number.
Step III: Join the points plotted in step II to obtain the required line. Note: If equation is in the form ax = b then we get a line parallel to y-axis and if equation is in form ay = b then we get a line parallel to x-axis.

→ In order to draw the graph of a linear equation ax + by + c = 0, we may follow the following algorithm.
Step I: Obtain the linear equation ax + by + c = 0.
Step II: Express y in terms of x i.e. y = \(-\frac{a}{b} x-\frac{c}{b}\) or x in terms of y i.e. x = \(-\frac{b}{a} y-\frac{c}{a}\).
Step III: Put any two or three values for x or y and calculate the corresponding values of y or x respectively from the expression obtained in Step II. Let us suppose that we get the points as (α1, β1),(α2, β2), (α3, β3).
Step IV: Plot the points (α1, β1), (α2, β2), (α3, β3) on graph paper.
Step V: Join the points marked in step IV. The line obtained is the graph of the equation ax + by + c = 0.
![]()
Different Forms Of A Line:
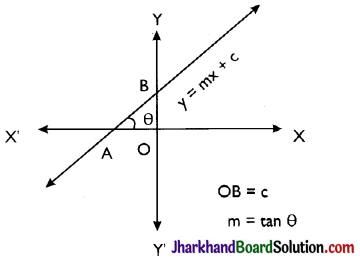
→ Slope of a Line: If a line makes an angle θ with positive direction of x-axis, then tangent of this angle is called the slope of a line, it is denoted by m i.e. m = tan θ.
→ Slope-intercept form is y = mx + c where m is the slope of line and c is intercept made by line with y-axis.
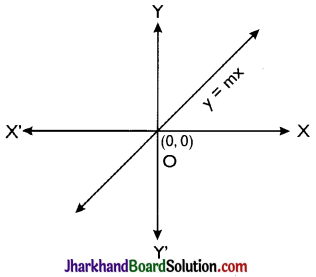
→ The equation of a line passing through origin is y = mx. When c = 0, the line always passes through origin.

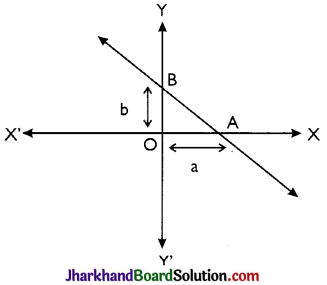
→ Intercept form of line is \(\frac{x}{a}+\frac{y}{b}=1\), where a and b are the intercepts on positive direction of x-axis and y-axis respectively made by the line.

Solution Of Linear Equation In One Variable:
Let ax + b = 0 be the equation then ax = – b
⇒ x= \(-\frac{b}{a}\) is a solution.