JAC Class 9 Maths Solutions Chapter 14 Statistics Ex 14.2

Jharkhand Board JAC Class 9 Maths Solutions Chapter 14 Statistics Ex 14.2 Textbook Exercise Questions and Answers.

JAC Board Class 9th Maths Solutions Chapter 14 Statistics Ex 14.2

Page-245

Question 1.
The blood groups of 30 students of Class VIII are recorded as follows:
A, B, O, O, AB, O, A, O, B, A, O, B, A, O, O
A, AB, O, A, A, O, O, AB, B, A, O, B, A, B, O.
Represent this data in the form of a frequency distribution table. Which is the most common, and which is the rarest, blood group among these students?
Answer:
The frequency means the number of students having same blood group. We will represent the data in table:

Blood Group Number of Students (Frequency)
A 9
B 6
O 12
AB 3
Total 30

Most common Blood Group (Highest frequency): O
Rarest Blood Group (Lowest frequency): AB

Question 2.
The distance (in km) of 40 engineers from their residence to their place of work w ere found as follows:

5 3 10 20 25
11 13 7 12 31
19 10 12 17 18
11 32 17 16 2
7 9 7 8 3
5 12 15 18 3
12 14 2 9 6
15 15 7 6 12

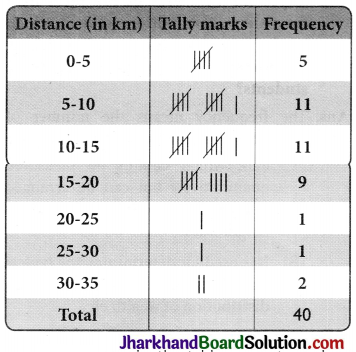
Construct a grouped frequency distribution table with class size 5 for the data given above taking the first interval as 0-5 (5 not included). What main features do you observe from this tabular representation?
Answer:
The given data is very large. So, we con-struct a group frequency of class size 5. Therefore, class interval will be 0-5, 5-10, 10-15, 15-20 and so on. The data is represented in the table as:
JAC Class 9 Maths Solutions Chapter 14 Statistics Ex 14.2 - 1
The classes in the table are not overlap¬ping. Also, 36 out of 40 engineers have their house below 7. 20 km of distance.

Question 3.
The relative humidity (in %) of a certain city for follows: a month of 30 days was as

98.1 98.6 99.2 90.3 86.5
95.3 92.9 96.3 94.2 95.1
89.2 92.3 97.1 93.5 92.7
95.1 97.2 93.3 95.2 97.3
96.2 92.1 84.9 90.2 95.7
98.3 97.3 96.1 92.1 89

(i) Construct a grouped frequency distribution table with classes 84 – 86, 86 – 88, etc.
(ii) Which month or season do you think this data is about?
(iii) What is the range of this data?
Answer:
(i) The given data is very large. So, we construct a group frequency of class size 2. Therefore, class interval will be 84-86, 86-88, 88-90, 90-92 and so on. The data is represented in the table as below:

Relative humidity (in %) Frequency
84-86 1
86-88 1
88-90 2
90-92 2
84-86 1
86-88 1
88-90 2
90-92 2
92-94 7
94-96 6
96-98 7
98-100 4
Total 30

(ii) The humidity is very high in the data which is observed during rainy season. So, it must be rainy season.
(iii) Range of data = Maximum value of data – Minimum value of data = 99.2 – 84.9 = 14.3%

JAC Class 9 Maths Solutions Chapter 14 Statistics Ex 14.2

Question 4.
The heights of 50 students, measured to the nearest centimetres, have been found to be as follows:

161 150 154 165 168
161 154 162 150 151
162 164 171 165 158
154 156 172 160 170
153 159 161 170 162
165 166 168 165 164
154 152 153 156 158
162 160 161 173 166
161 159 162 167 168
159 158 153 154 159

(i) Represent the data given above by a grouped frequency distribution table, taking the class intervals as 150-155,155-160, etc. soon.
(ii) What can you conclude about their heights from the table?
Answer:
(i) The data with class interval 150-155, 155-160 and so on is represented in the table as:

Height (in cm) No. of Students (Frequency)
150-155 12
155-160 9
160-165 14
165-170 10
170-175 5
Total 50

(ii) From the given data, it can be concluded that 35 students i.e. more than 50% are shorter than 165 cm.

Question 5.
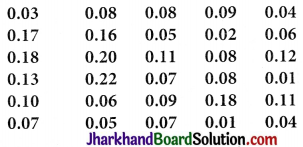
A study was conducted to find out the concentration of sulphur dioxide in the air in parts per million (ppm) of a certain city. The data obtained for 30 days is as follows:
JAC Class 9 Maths Solutions Chapter 14 Statistics Ex 14.2 - 2
(i) Make a grouped frequency distribution table for this data with class intervals as 0.00-0.04, 0.04-0.08, and so on.
(ii) For how many days, was the concentration of sulphur dioxide more than 0.11 parts per million?
Answer:
(i) The data with class interval 0.00 – 0.04, 0.04 – 0.08 and so on is represented in the table as:

Concentration of sulphur dioxide in air (in ppm) Frequency
0.00 – 0.04 4
0.04 – 0.08 9
0.08 – 0.12 9
0.12-0.16 2
0.16-0.20 4
0.20 – 0.24 2
Total 30

(ii) 2 + 4 + 2 = 8 days have the concentration of sulphur dioxide more than 0.11 parts per million.

Page-246

Question 6.
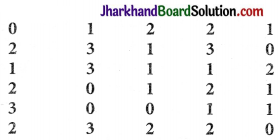
Three coins were tossed 30 times simultaneously. Each time the number of heads occurring was noted down as follows:
JAC Class 9 Maths Solutions Chapter 14 Statistics Ex 14.2 - 3
Prepare a frequency distribution table for the data given above.
Answer:
The frequency distribution table for the data given above can be prepared as follows:

Number of Heads Frequency
0 6
1 10
2 9
3 5
Total 30

JAC Class 9 Maths Solutions Chapter 14 Statistics Ex 14.2

Question 7.
The value of π upto 50 decimal places is given below:
3.14159265358979323846264338327950288419716939937510
(i) Make a frequency distribution of the digits from 0 to 9 after the decimal point.
(ii) What are the most and the least frequently occurring digits?
Answer:
(i) The frequency is given as follows:

Digits Frequency
0 2
1 5
2 5
3 8
4 4
5 5
6 4
7 4
8 5
9 8
Total 50

(ii) The digit having the least frequency occurs the least and the digit with highest frequency occurs the most. 0 has frequency 2 and thus occurs least frequently while 3 and 9 have frequency 8 and thus occur most frequently.

Question 8.
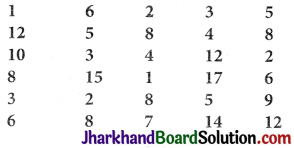
Thirty children were asked about the number of hours they watched TV programmes in the previous week. The results were found as follows:
JAC Class 9 Maths Solutions Chapter 14 Statistics Ex 14.2 - 4
(i) Make a grouped frequency distribution table for this data, taking class width 5 and one of the class intervals as 5-10.
(ii) How many children watched television for 15 or more hours a week?
Answer:
(i) The distribution table for the given data, taking class width 5 and one of the class intervals as 5-10 is as follows:

Number of Hours Frequency
0 – 5 10
5 – 10 13
10 – 15 5
15 – 20 2
Total 30

(ii) We observed from the given table that 2 children watched television for 15 or more hours a week.

Question 9.
A company manufactures car batteries of a particular type. The lives (in years) of 40 such batteries were recorded as follows:
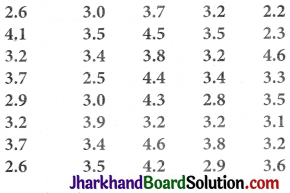
JAC Class 9 Maths Solutions Chapter 14 Statistics Ex 14.2 - 5
Construct a grouped frequency distribution table for this data, using class intervals of size 0.5 starting from the interval 2-2.5.
Answer:
A grouped frequency distribution table using class intervals of size 0.5 starting from the interval 2-2.5 is constructed.

Lives of batteries (in years) No. of batteries (Frequency)
2 – 2.5 2
2.5 – 3 6
3 – 3.5 14
3.5 – 4 11
4 – 4.5 4
4.5 – 5 3
Total 40

JAC Class 9 Maths Solutions Chapter 14 Statistics Ex 14.1

Jharkhand Board JAC Class 9 Maths Solutions Chapter 14 Statistics Ex 14.1 Textbook Exercise Questions and Answers.

JAC Board Class 9th Maths Solutions Chapter 14 Statistics Ex 14.1

Page-239

Question 1.
Give five examples of data that you can collect from your day-to-day life.
Answer:
Five examples from day-to-day life:
(i) Daily expenditures of household.
(ii) Amount of rainfall.
(iii) Bill of electricity.
(iv) Poll or survey results.
(v) Marks obtained by students.

JAC Class 9 Maths Solutions Chapter 14 Statistics Ex 14.1

Question 2.
Classify the data in Q. 1 above as primary or secondary data.
Answer:
Primary Data: (i), (iii) and (v)
Secondary Data: (ii) and (iv)

JAC Class 9 Maths Solutions Chapter 9 Areas of Parallelograms and Triangles Ex 9.2

Jharkhand Board JAC Class 9 Maths Solutions Chapter 9 Areas of Parallelograms and Triangles Ex 9.2 Textbook Exercise Questions and Answers.

JAC Board Class 9th Maths Solutions Chapter 9 Areas of Parallelograms and Triangles Ex 9.2

Page-159

Question 1.
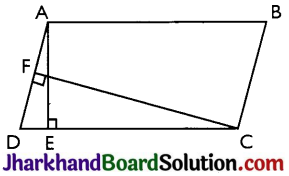
In Fig, ABCD is a parallelogram, AE ⊥ DC and CF ⊥ AD. If AB = 16 cm, AE = 8 cm and CF = 10 cm, find AD.
JAC Class 9 Maths Solutions Chapter 9 Areas of Parallelograms and Triangles Ex 9.2 - 1
Answer:
Given: AB = CD = 16 cm (Opposite sides of a parallelogram)
CF = 10 cm and AE = 8 cm
Now, Area of parallelogram = Base × Altitude = CD × AE = AD × CF
⇒ 16 × 8 = AD × 10
⇒ AD = \(\frac{128}{10}\) cm
⇒ AD = 12.8 cm

JAC Class 9 Maths Solutions Chapter 9 Areas of Parallelograms and Triangles Ex 9.2

Question 2.
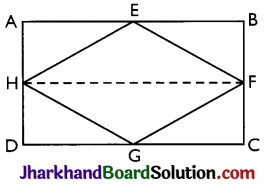
If E, F, G and H are respectively the mid-points of the sides of a parallelogram ABCD, show that
ar(EFGH) = \(\frac{1}{2}\) ar(ABCD)
JAC Class 9 Maths Solutions Chapter 9 Areas of Parallelograms and Triangles Ex 9.2 - 2
Answer:
Given: E, F, G and H are respectively the mid-points of the sides of a parallelogram ABCD.
To Prove: ar (EFGH) = \(\frac{1}{2}\) ar(ABCD)
Construction: H and F are joined.
Proof: AD || BC and AD = BC (Opposite sides of a Parallelogram)
⇒ AH || BF and \(\frac{1}{2}\) AD = \(\frac{1}{2}\) BC
⇒ AH || BF and AH = BF (Hand Fare mid points)
Thus, ABFH is a parallelogram.
[Since a pair of lines is equal and parallel]
⇒ AB || HF

Now, AEFH and ||gm ABFH lie on the same base FH and between the same parallel lines AB and HF.
∴ area of AEFH = \(\frac{1}{2}\) area of ABFH ……..(i)
AD || BC and AD = BC [Opposite sides of a parallelogram ABCD]
⇒ DH CF and \(\frac{1}{2}\) AD = \(\frac{1}{2}\) BC
⇒ DH || CFand DH = CF [As Hand Fare mid-point of AD and BC respectively]
⇒ CDHF is a parallelogram [Since a pair of opposite sides is equal and parallel]
Now, AFGH and parallelogram CDHF lie an same base HF and between the same parallel lines HF and CD
∴ area of AFGH = \(\frac{1}{2}\) area of CDHF ……..(ii)

Adding (i) and (ii),
area of AEFH + area of AGHF
= \(\frac{1}{2}\) area of ABFH + \(\frac{1}{2}\) area of HFCD
⇒ area of EFGH = \(\frac{1}{2}\) area of ABCD
⇒ ar (EFGH) = \(\frac{1}{2}\) ar(ABCD)

Question 3.
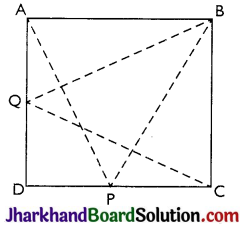
P and Q are any two points lying on the sides DC and AD respectively of a parallelogram ABCD. Show that ar(APB) = ar(BQC).
JAC Class 9 Maths Solutions Chapter 9 Areas of Parallelograms and Triangles Ex 9.2 - 3
Answer:
∆APB and ||gm ABCD are on the same base AB and between same parallels AB and DC.
Therefore, (∆APB) = ar(||gm ABCD) ……….(i)
Similarly,
ar(∆BQC) = \(\frac{1}{2}\) ar(||gm ∆BCD) ………(ii)
From (i) and (ii),
we have, ar(∆APB) = ar(∆BQC)

Question 4.
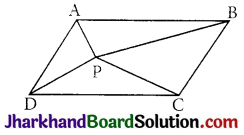
In Fig, P is a point in the interior of a parallelogram ABCD. Show that
(i) ar(∆APB) + ar(∆PCD) = \(\frac{1}{2}\) ar(||gm ABCD)
(ii) ar(∆APD) + ar(∆PBC) = ar(∆APB) + ar(∆PCD)
[Hint: Through P, draw a line parallel to AB.]
JAC Class 9 Maths Solutions Chapter 9 Areas of Parallelograms and Triangles Ex 9.2 - 4
Answer:
Img 5
(i) Draw a line GH is drawn parallel to AB passing through P.
In parallelogram ABCD
AB || GH (by construction) …………(i)
AD || BC (Opposite sides of parallelogram ABCD)
⇒ AG || BH …(ii)
From equations (i) and (ii),
ABHG is a parallelogram.

Now, ∆APB and parallelogram ABHG are lying on the same base AB and between the same parallel lines AB and GH.
∴ ar(∆APB) = \(\frac{1}{2}\) ar(∆BHG) …(iii)
Now, AB || GH (By construction)
AB || CD (Opposite sides of parallelogram)
⇒ CD || GH (Lines parallel to same line are parallel to each other)
Also, CH || GD (as AD || BC)
∴ CDGH is a parallelogram.

Now, APCD and parallelogram CDGH are lying on the same base CD and between the same parallel lines CD and GH.
ar(APCD) = \(\frac{1}{2}\) ar(CDGH)
Adding equations (iii) and (iv),
ar(AAPB) + ar(APCD) = \(\frac{1}{2}\) [ar(ABHG) + ar(CDGH)]
⇒ ar(AAPB) + ar(APCD) = \(\frac{1}{2}\) ar(||gm ABCD).

(ii) A line EF is drawn parallel to AD passing through P.
In a parallelogram ABCD
AD || EF (by construction) ……..(v)
Also, AB || CD
⇒ AE || DF ………..(vi)
From equations (v) and (vi), AEFD is a parallelogram.

Now, ∆ APD and parallelogram AEFD are lying on the same base AD and between the same parallel lines AD and EF.
ar(∆APD) = \(\frac{1}{2}\) ar(AEFD) ……(vii)
Now, AD || EF (By construction) AD||BC (Opposite sides of parallelogram)
⇒ BC || EF
Also, AB || CD
⇒ BE || CF
BCFE is a parallelogram.

Also, ∆PBC and parallelogram BCFE are lying on the same base BC and between the same parallel lines BC and EF.
∴ ar(∆PBC) = \(\frac{1}{2}\) ar(BCFE) …(viii)
Adding equations (vii) and (viii),
ar(∆APD) + ar(∆PBC)
= \(\frac{1}{2}\) [ar(AEFD) + ar(BCFE)]
= \(\frac{1}{2}\) ar(ABCD)
⇒ ar(∆APD) + ar(∆PBC) = ar(∆APB) + ar(∆PCD)

Question 5.
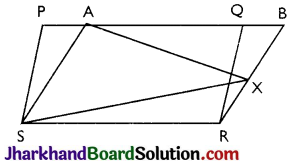
In Fig, PQRS and ABRS are parallelograms and X is any point on side BR. Show that
(i) ar(PQRS) = ar(ABRS)
(ii) ar(∆AXS) = \(\frac{1}{2}\) ar(PQRS)
JAC Class 9 Maths Solutions Chapter 9 Areas of Parallelograms and Triangles Ex 9.2 - 6
Answer:
(i) Parallelogram PQRS and ABRS lie on the same base SR and between the same parallel lines SR and PB.
∴ ar(PQRS) = ar(ABRS) …………(i)

(ii) ∆AXS and parallelogram ABRS are lying on the same base AS and between the same parallel lines AS and BR.
ar(∆AXS) = \(\frac{1}{2}\) ar(ABRS) …(ii)
From (i) and (ii),
ar(∆AXS) = \(\frac{1}{2}\) ar(PQRS)

Page-160

Question 6.
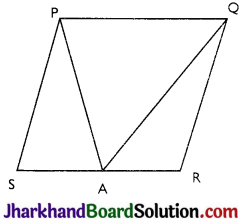
A farmer was having a field in the form of a parallelogram PQRS. She took any point A on RS and joined it to points P and Q. In howT many parts the fields is divided? What are the shapes of these parts? The farmer wants to sow7 wheat and pulses in equal portions of the field separately. How should she do it?
JAC Class 9 Maths Solutions Chapter 9 Areas of Parallelograms and Triangles Ex 9.2 - 7
Answer:
The field is divided into three parts. The three parts are in the shape of triangles.
These are ∆PSA, ∆PAQ and ∆QAR.
Area of ∆PSA + ∆PAQ + ∆QAR = Area of PQRS …….(i)
Area of APAQ = \(\frac{1}{2}\) area of PQRS ……….(ii)
(v Triangle and parallelogram are on the same base and between the same parallel lines.)
From (i) and (ii),
Area of ∆PSA + Area of ∆QAR = \(\frac{1}{2}\) area of PQRS … (iii)
Clearly from (ii) and (iii),
Farmer must sow wheat or pulses in ∆PAQ or in both ∆PSA and ∆QAR.

JAC Class 9 Maths Solutions Chapter 13 Surface Areas and Volumes Ex 13.9

Jharkhand Board JAC Class 9 Maths Solutions Chapter 13 Surface Areas and Volumes Ex 13.9 Textbook Exercise Questions and Answers.

JAC Board Class 9th Maths Solutions Chapter 13 Surface Areas and Volumes Ex 13.9

Question 1.
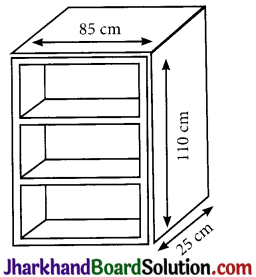
A wooden bookshelf has external dimensions as follows: Height = 110 cm, Depth = 25 cm, Breadth = 85 cm (see Fig. 13.31). The thickness of the plank is 5 cm everywhere. The external faces are to be polished and the inner faces are to be painted. If the rate of polishing is 20 paise per cm2 and the rate of painting is 10 paise per cm2, find the total expenses required for polishing and painting the surface of the bookshelf.
JAC Class 9 Maths Solutions Chapter 13 Surface Areas and Volumes Ex 13.9 - 1
Solution:
Let L, B, H be the external length, breadth and height of the bookshelf
Here L= 110 cm, B= 85 cm, H = 25 cm
let l, b, h be the internal length, breadth and height of the bookshelf

Thickness of the plank = 5cm
l = (110 – 5 – 5) cm = 100cm
b = (85 – 5 – 5) cm = 75cm,
h = (25 – 5) cm = 20 cm

External surface area of the bookshelf = LB + 2 (BH + RL)
= 110 × 85 cm2 + 2(85 × 25 + 25 × 110) cm2
= (9350 ÷ 9750) cm2 = 19100 cm2

Surface area of the border
= (4 × 75 × 5 + 110 × 5 × 2) cm2
= (1500 + 1100) cm2 =2600 cm2

∴ Total surface area to be polished
= (19100 + 2600) cm2
= 21700 cm2

Rate of polishing per cm2 = 20 paise = ₹ \(\frac{20}{100}\)

∴ Cost of polishing the outer surface = ₹ \(\frac{21700 \times 20}{100}\) = ₹ 4340 ……(i)

Area to be painted = lb + 2 (bh + hl)
= 100 × 75 + 2 (75 × 20 + 20 × 100)
= 7500 + 7000
= 14500 cm2

Surface area of two rack = 4 × 75 × 20 = 6000 cm2

Inner Surface area covered by rack = (75 × 5 × 2 + 20 × 5 × 4)
= 1150 cm2

Total Surface area to be painted = 14500 + 6000 – 1150 = 19350 cm2

Cost of painting the inner surface at the rate of 10 paise per cm2
= ₹ \(\frac{19350 \times 10}{100}\) = ₹ 1935

Form (i) and (ii), we have
Total expenses required for polished and painting the surface of the bookshelf.
= ₹ 4340 + ₹ 1935 = ₹ 6275

JAC Class 9 Maths Solutions Chapter 13 Surface Areas and Volumes Ex 13.9

Page-237

Question 2.
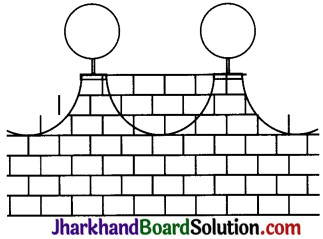
The front compound wall of a house is decorated by wooden spheres of diameter 21 cm, placed on small supports as shown in Fig. 13.32. Eight such spheres are used for this purpose, and are to be painted silver. Each support is a cylinder of radius 1.5 cm and height 7 cm and is to be painted black. Find the cost of paint required if silver paint costs 25 paise per cm2 and black paint costs 5 paise per cm2.
JAC Class 9 Maths Solutions Chapter 13 Surface Areas and Volumes Ex 13.9 - 2
Solution:
Let R be the radius of the sphere and R, H be the radius and height of cylinder.
Radius of sphere (R) = \(\frac{21}{2}\) = 10.5 cm
Surface area of a sphere = 4πr2
= 4 × \(\frac{22}{7}\) × 10.5 × 10.5 cm2

Area of the top of the cylinder (support) = πR2
= π(1.5)2 = cm2
= 7.07 cm2

Area of the sphere to be painted silver = (1386 – 7.07) cm2
= 1378. 93 cm2

Cost of silver paint per cm2 = 25 paise

Cost of painting spheres = ₹ \(\frac{8 \times 1387.93 \times 25}{100}\)
= ₹ 2757.86 (approx.)

Curved surface area of a cylinder (support) = 2πRH
= 2 × \(\frac{22}{7}\) × 1.5 × 7 cm2

Cost of black paint per cm2 = 5 paise

Curved surface area of 8 supports = 8 × 2 × \(\frac{22}{7}\) × 1.5 × 7 cm2

Cost of painting the supports
= ₹ 8 × 2 × \(\frac{22}{7}\) × 1.5 × 7 × \(\frac{5}{100}\)
= ₹ 26.40

Total cost = ₹ (2757.86 + 26.40)
= ₹ 2784.26.

JAC Class 9 Maths Solutions Chapter 13 Surface Areas and Volumes Ex 13.9

Question 3.
The diameter of a sphere is decreased by 25%. By what percent does its curved surface area decrease?
Solution:

Let the diameter of sphere be 2r.
Then, Radius of the sphere =r
Surface area of sphere = 4πr2 …..(i)
New diameter of the sphere = 2r – 2r × \(\frac{25}{100}\) = \(\frac{3r}{2}\)

New radius of the sphere = \(\frac{3r}{4}\)

Surface area of the new sphere
= \(=4 \pi\left(\frac{3 r}{4}\right)^2=\frac{9 \pi r^2}{4}\)

Decrease in surface area = 4πr2 – \(\frac{9 \pi r^2}{4}\) = \(\frac{7 \pi r^2}{4}\)

Percent decrease
JAC Class 9 Maths Solutions Chapter 13 Surface Areas and Volumes Ex 13.9 - 3
Hence, the surface area decrease by 43.75%.

JAC Class 9 Maths Solutions Chapter 6 Lines and Angles Ex 6.1

Jharkhand Board JAC Class 9 Maths Solutions Chapter 6 Lines and Angles Ex 6.1 Textbook Exercise Questions and Answers.

JAC Board Class 9th Maths Solutions Chapter 6 Lines and Angles Ex 6.1

Page-96

Question 1.
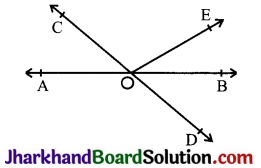
In Fig, lines AB and CD intersect at O. If ∠AOC + ∠BOE = 70° and ∠BOD = 40°, find ∠BOE and reflex ∠COE.
JAC Class 9 Maths Solutions Chapter 6 Lines and Angles Ex 6.1 - 1
Answer:
Given,
∠AOC + ∠BOE = 70° and ∠BOD = 40°
∠AOC + ∠BOE + ∠COE = 180° (Forms a straight line)
⇒ 70° + ∠COE = 180°
⇒ ∠COE = 110°
∴ Reflex ∠COE = 360° – ∠COE = 360°- 110° = 250°
Also, ∠COE + ∠BOD + ∠BOE = 180° (Forms a straight line)
⇒ 110° + 40° + ∠BOE = 180°
⇒ 150° + ∠BOE = 180°
⇒ ∠BOE = 30°

Page-97

Question 2.
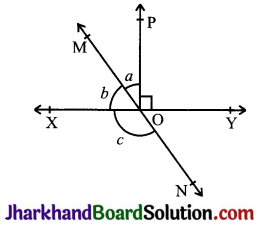
In Fig, lines XY and MN intersect at O. If ∠POY = 90° and a : b = 2 : 3, find c.
JAC Class 9 Maths Solutions Chapter 6 Lines and Angles Ex 6.1 - 2
Answer:
Given, ∠POY = 90° and a : b = 2 : 3
∠POY + a + b = 180°
⇒ 90° + a + b = 180°
⇒ a + b = 90°

Let a be 2x and b be 3x.
∴ 2x + 3x = 90°
⇒ 5x = 90°
⇒ x = 18°
∴ a = 2 × 18° = 36° and b = 3 × 18° = 54°
Also, b + c = 180° (Linear Pair)
⇒ 54° + c = 180°
⇒ c = 126°

JAC Class 9 Maths Solutions Chapter 6 Lines and Angles Ex 6.1

Question 3.
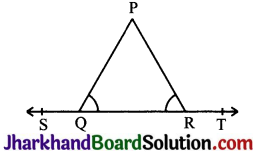
In Fig, if ∠PQR = ∠PRQ, then prove that ∠PQS = ∠PRT.
JAC Class 9 Maths Solutions Chapter 6 Lines and Angles Ex 6.1 - 3
Answer:
Given: ∠PQR = ∠PRQ
To prove: ∠PQS = ∠PRT
Proof: ∠PQR + ∠PQS = 180° (Linear Pair)
⇒ ∠PQS = 180° – ∠PQR …….(i)
also, ∠PRQ + ∠PRT = 180° (Linear Pair)
⇒ ∠PRT = 180°- ∠PRQ
∠PRT = 180° – ∠PQR (∠PQR = ∠PRQ)…(ii)
From (i) and (ii)
∠PQS = ∠PRT = 180° – ∠PQR
Therefore, ∠PQS = ∠PRT

Question 4.
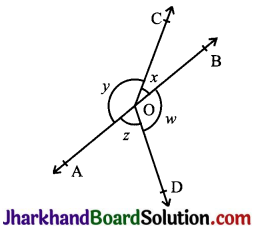
In Fig, if x + y = w + z, then prove that AB is a line.
JAC Class 9 Maths Solutions Chapter 6 Lines and Angles Ex 6.1 - 4
Answer:
Given: x + y = w + z
To prove: AB is a line or x + y = 180° (linear pair)
Proof: x + y + w + z = 360° (Angles around a point)
⇒ (x + y) + (x + y) = 360° (Given x + y = w + z)
⇒ 2(x + y) = 360°
⇒ (x + y) = 180°
Hence, x + y makes a linear pair. Therefore, AB is a straight line.

Question 5.
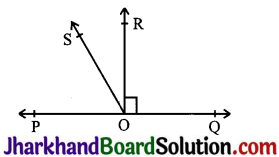
In Fig, if PQ is a line. Ray OR is perpendicular to line PQ. OS is another ray lying between rays OP and OR.
Prove that ∠ROS = \(\frac{1}{2}\) (∠QOS – ∠POS).
JAC Class 9 Maths Solutions Chapter 6 Lines and Angles Ex 6.1 - 5
Answer:
Given: OR is perpendicular to line PQ
To prove: ∠ROS = \(\frac{1}{2}\) (∠QOS – ∠POS).
Proof: ∠POR = ∠ROQ = 90° (Perpendicular)
∠QOS=∠ROQ+∠ROS=90°+∠ROS ……(i)
∠POS = ∠POR – ∠ROS = 90° – ∠ROS …….(ii)

Subtracting (ii) from (i)
∠QOS – ∠POS = (90° + ∠ROS) – (90° – ∠ROS)
⇒ ∠QOS – ∠POS = 90° + ∠ROS – 90° + ∠ROS
⇒ ∠QOS – ∠POS = 2 ∠ROS
⇒ ∠ROS = \(\frac{1}{2}\) (∠QOS – ∠POS)
Hence, proved.

JAC Class 9 Maths Solutions Chapter 6 Lines and Angles Ex 6.1

Question 6.
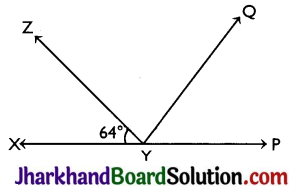
It is given that ∠XYZ = 64° and XY is produced to point P. Draw a figure from the given information. If ray YQ bisects ∠ZYP, find ∠XYQ and reflex ∠QYP.
JAC Class 9 Maths Solutions Chapter 6 Lines and Angles Ex 6.1 - 6
Answer:
Given ∠XYZ = 64°
YQ bisects ∠YP
∠XYZ + ∠ZYP = 180° (Linear Pair)
⇒ 64° + ∠ZYP = 180°
⇒ ∠ZYP = 116°
Also, ∠ZYP = ∠ZYQ + ∠QYP
∠ZYQ = ∠QYP (YQ bisects ZYP)
⇒ ∠ZYP = 2 ∠ZYQ
⇒ 2 ∠ZYQ =116°
⇒ ∠ZYQ = 58° = ∠QYP
Now, ∠XYQ = ∠XYZ + ∠ZYQ
⇒ ∠XYQ = 64° + 58°
⇒ ∠XYQ = 122°
Also, reflex ∠QYP = 180° + ∠XYQ
= 180° + 122° = 302°

JAC Class 9 Maths Solutions Chapter 13 Surface Areas and Volumes Ex 13.8

Jharkhand Board JAC Class 9 Maths Solutions Chapter 13 Surface Areas and Volumes Ex 13.8 Textbook Exercise Questions and Answers.

JAC Board Class 9th Maths Solutions Chapter 13 Surface Areas and Volumes Ex 13.8

Question 1.
Find the volume of a sphere whose radius is :
(i) 7 cm
(ii) 0.63 m.
Solution:
(i) Radius of the sphere (r) = 7 cm
Therefore, Volume of sphere = \(\frac{4}{3}\)πr3
= \(\frac{4312}{3}\) cm3.

(ii) Radius of the sphere (r) = 0.63 m
∴ Volume of the sphere = \(\frac{4}{3}\)πr3
= \(\frac{4}{3} \times \frac{22}{7} \times 0.63 \times 0.63 \times 0.63\) m3
= 1.05 m3

Question 2.
Find the amount of water displaced by a solid spherical ball of diameter :
(i) 28 cm
(ii) 0.21 m.
Solution:
(i) Diameter of spherical ball = 28 cm
Radius (r) = \(\frac{28}{2}\) cm = 14 cm

Amount of water displaced by spherical ball = Volume of spherical ball
= \(\frac{4}{3}\)πr3
= \(\frac{4}{3} \times \frac{22}{7} \times 14 \times 14 \times 14\) cm3
= \(\frac{34496}{3}\) cm3

(ii) Diameter of spherical ball = 0.21 m
∴ Radius (r) = \(\frac{0.21}{2}\) = 0.105 m

Amount of water displaced by spherical ball = Volume of spherical ball
= \(\frac{4}{3}\)πr3
= \(\frac{4}{3} \times \frac{22}{7}\) × 0.105 × 0.105 × 0.105 m3
= 0.004851 m3

JAC Class 9 Maths Solutions Chapter 13 Surface Areas and Volumes Ex 13.8

Question 3.
The diameter of a metallic ball is 4.2 cm. What is the mass of the ball, if the density of the metal is 8.9 g per cm3?
Solution:
Radius (r) = \(\frac{4.2}{2}\) = 2.1 cm
Volume of spherical ball = \(\frac{4}{3}\)πr3
= 38.808 cm3

Density of the metal is 8.9 g per cm3
mass of the ball = (38.808 × 8.9) g
= 345.3912 g

Question 4.
The diameter of the moon is approximately one-fourth of the diameter of the earth. What fraction of the volume of the earth is the volume of the moon?
Solution:
Let the diameter of the moon be r.
Radius of the moon = \(\frac{r}{2}\)
Diameter of the earth = 4r
Radius (R) = \(\frac{4r}{2}\) = 2r

Volume of the earth = v = \(\frac{4}{3}\)π\(\frac{r}{2}\)3
8v = \(\frac{4}{3}\)πr3 × \(\frac{1}{83}\) ……(i)

Volume of the earth = V = \(\frac{4}{3}\)π(2r)3
= \(\frac{4}{3}\)π(r)3 × 8
= \(\frac{V}{8}\) = \(\frac{4}{3}\)πr3 ………(ii)

From (i) and (ii), we have
8v = \(\frac{V}{8}\)
v = \(\frac{1}{64}\) V
Thus, the volume of the moon is of \(\frac{1}{64}\) the volume of the earth.

Question 5.
How many litres of milk can a hemispherical bowl of diameter 10.5 cm hold.
Solution:
Diameter of hemispherical bowl = 10.5 cm
Radius (r) = \(\frac{10.5}{2}\) = 5.25 cm

Volume of the bowl = \(\frac{2}{3} \pi r^3\)
= \(\frac{2}{3} \times \frac{22}{7} \times 5.25 \times 5.25 \times 5.25\) cm3
= 303.1875 cm3

Litres of milk bowl can hold = \(\frac{303.1875}{1000}\)
= 0.3031875 litres (approx.)

JAC Class 9 Maths Solutions Chapter 13 Surface Areas and Volumes Ex 13.8

Question 6.
A hemispherical tank is made up of an iron sheet 1 cm thick. If the inner radius is 1 m, then find the volume of the iron used to make the tank.
Solution:
Inner radius = r = 1 m
External radius = R = (1 + 0.01) m = 1.01 m

Volume of the iron used = External volume – Internal volume
= \(\frac{2}{3}\)πR3 – \(\frac{2}{3}\)πr3
= \(\frac{2}{3}\)π[R3 – r3]
= \(\frac{2}{3} \times \frac{22}{7}\)[(1.01)3 – (1)3] m3
= \(\frac{44}{21}\)(1.030301 – 1) m3
= \(\frac{44}{21}\) × 0.030301 m3
= 0·06348 m3 (approx.)

Question 7.
Find the volume of a sphere whose surface area is 154 cm2.
Solution:
Let r cm be the radius of sphere.
Surface area of the sphere = 154 cm2
⇒ 4πr2 = 154
⇒ 4 × \(\frac{22}{7}\) × r2 = 154
⇒ r2 = \(\frac{(154×7)}{(4×22)}\) = 12.25
⇒ r = 3.5 cm

Volume = \(\frac{4}{3} \pi r^3\)
= \(\frac{4}{3}\) × \(\frac{22}{7}\) × 3.5 × 3.5 × 3.5 cm3
= \(\frac{539}{3}\) cm3.

Question 8.
A dome of a building is in the form of a hemisphere. From inside, it was white washed at the cost of ₹ 498.96. If the cost of the white-washing is ₹ 2.00 per square metre, find the :
(i) inside surface area of the dome,
(ii) volume of the air inside the dome.
Solution:
(i) Inside surface area of the dome = Total cost of white washed/Rate of white washed per square metre
= \(\frac{498.96}{2.00}\) m2 = 249.48 m2

(ii) Let r be the radius of the dome.
Surface area = 2πr2
⇒ 2 × \(\frac{22}{7}\) × r2 = 249.48
⇒ r2 = \(\frac{249.48 \times 7}{22 \times 2}\) = 39.69
⇒ r2 = 39.69
⇒ r = 6.3 m.

Volume of the air inside the dome = Volume of the dome
= \(\frac{2}{3}\)πr3
= \(\frac{2}{3} \times \frac{22}{7}\) × 6.3 × 6.3 × 6.3
= 523.9 m3 (approx.)

JAC Class 9 Maths Solutions Chapter 13 Surface Areas and Volumes Ex 13.8

Question 9.
Twenty seven solid iron spheres, each of radius r and surface area S are melted to form a sphere with surface area S’. Find the :
(i) radius r’ of the new sphere,
(ii) radio of S and S’.
Solution:
Volume of 27 solid spheres of radius
r = 27 × \(\frac{4}{3}\)πr3

Volume of the new sphere of radius
r’ = \(\frac{4}{3} \pi r^{\prime} 3\)
⇒ \(\frac{4}{3} \pi r^{\prime} 3=27 \times \frac{4}{3} \pi r^3\)
⇒ \(r^{\prime 3}=\frac{27 \times \frac{4}{3} \pi r^3}{\frac{4}{3} \pi}\)
⇒ r’3 = 27r3 = (3r)3
⇒ r’= 3r

(ii) Required ratio = S’ = \(\frac{4 \pi r^2}{4 \pi r^{\prime 2}}\)
= \(\frac{r^2}{(3 r)^2}=\frac{r^2}{9 r^2}=\frac{1}{9}\) = 1 : 9

Question 10.
A capsule of medicine is in the shape of a sphere of diameter 3.5 mm. How much medicine (in mm3) is needed to fill this capsule?
Solution:
Diameter of spherical capsule = 3.5 mm
Radius (r)= \(\frac{3.5}{2}\) mm = 1.75 mm

Medicine needed for its filling = Volume of spherical capsule = \(\frac{4}{3}\)πr3
= \(\frac{4}{3} \times \frac{22}{7}\) × 1.75 × 1.75 × 1.75 mm3
= 22.46 mm3 (approx.)

JAC Class 9 Maths Solutions Chapter 1 Number Systems Ex 1.4

Jharkhand Board JAC Class 9 Maths Solutions Chapter 1 Number Systems Ex 1.4 Textbook Exercise Questions and Answers.

JAC Board Class 9th Maths Solutions Chapter 1 Number Systems Exercise 1.4

Question 1.
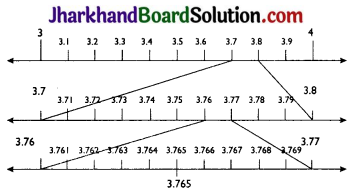
Visualise 3.765 on the number line using successive magnification.
Answer:
JAC Class 9 Maths Solutions Chapter 1 Number Systems Ex 1.4 - 1

JAC Class 9 Maths Solutions Chapter 1 Number Systems Ex 1.4

Question 2.
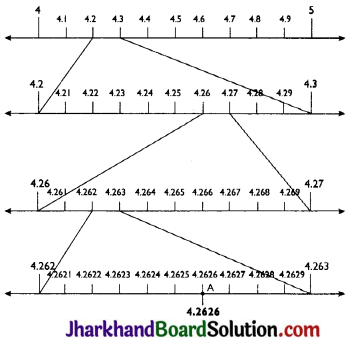
Visualize 4.26 on the number line, up to 4 decimal places.
Answer:
\(4 . \overline{26}\) = 4.2626…
JAC Class 9 Maths Solutions Chapter 1 Number Systems Ex 1.4 - 2

JAC Class 9 Maths Solutions Chapter 3 Coordinate Geometry Ex 3.2

Jharkhand Board JAC Class 9 Maths Solutions Chapter 3 Coordinate Geometry Ex 3.2 Textbook Exercise Questions and Answers.

JAC Board Class 9th Maths Solutions Chapter 3 Coordinate Geometry Ex 3.2

Page – 61

Question 1.
Write the answer of each of the following questions:
(i) What is the name of horizontal and the vertical lines drawn to determine the position of any point in the Cartesian plane?
(ii) What is the name of each part of the plane formed by these two lines?
(iii) Write the name of the point where these two lines intersect.
Answer:
(i) The names of horizontal line and vertical line drawn to determine the position of any point in the Cartesian plane are x-axis and y-axis respectively.
(ii) The name of each part of the plane formed by these two lines x-axis and y-axis is quadrant.
(iii) The point where these two lines intersect is called origin.

JAC Class 9 Maths Solutions Chapter 3 Coordinate Geometry Ex 3.2

Question 2.
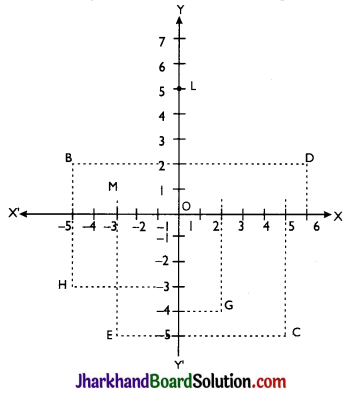
See Fig., and write the following:
JAC Class 9 Maths Solutions Chapter 3 Coordinate Geometry Ex 3.2 - 1
(i) The coordinates of B.
(ii) The coordinates of C.
(iii) The point identified by the coordinates (-3, -5).
(iv) The point identified by the coordinates (2, -4).
(v) The abscissa of the point D.
(vi) The ordinate of the point H.
(vii) The coordinates of the point L.
(viii)The coordinates of the point M.
Answer:
(i) The coordinates of B are (-5, 2).
(ii) The coordinates of C are (5, -5).
(iii) The point identified by the coordinates (-3, -5) is E.
(iv) The point identified by the coordinates (2,-4) is G.
(v) Abscissa means x-coordinate of a point. So, abscissa of the point D is 6.
(vi) Ordinate means y-coordinate of a point. So, ordinate of point H is -3.
(vii) The coordinates of the point L are (0, 5).
(viii) The coordinates of the point M are (-3,0).

JAC Class 9 Maths Solutions Chapter 2 Polynomials Ex 2.5

Jharkhand Board JAC Class 9 Maths Solutions Chapter 2 Polynomials Ex 2.5 Textbook Exercise Questions and Answers.

JAC Board Class 9th Maths Solutions Chapter 2 Polynomials Ex 2.5

Question 1.
Use suitable identities to find the following products:
(i) (x + 4) (x + 10)
(ii) (x + 8) (x – 10)
(iii) (3x + 4) (3x – 5)
(iv) (y2 + 3/2) (y2 – 3/2)
(v) (3 – 2x) (3 + 2x)
Answer:
(i) Using identity, (x + a) (x + b)
= x2 + (a + b) x + ab
In (x + 4) (x + 10), a = 4 and b = 10
Now,
(x + 4) (x + 10)
= x2 + (4 + 10)x + (4 × 10)
= x2 + 14x+ 40

(ii) (x + 8) (x – 10)
Using identity, (x + a) (x + b)
= x2 + (a + b) x + ab
Here, a = 8 and b = -10
(x + 8) (x – 10)
= x2 + {8 + (- 10)}x + {8 × (- 10)}
= x2 + (8 – 10)x – 80
= x2 – 2x – 80

(iii) (3x + 4) (3x – 5)
Using identity, (x + a) (x + b)
= x2 + (a + b) x + ab
Here, x as 3x, a = 4 and b = – 5
(3x + 4) (3x – 5)
= (3x)2 + {4 + (-5)}3x + {4 × (-5)}
= 9x2 + 3x(4 – 5) – 20
= 9x2 – 3x – 20

(iv) (y2 + 3/2) (y2 – 3/2)
Using identity, (x + y) (x – y) = x2 – y2
Here, x = y2 and y = 3/2
(y2 + 3/2) (y2 – 3/2)
= (y2)2 – (3/2)2
= y4 – 9/4

(v) (3 – 2x) (3 + 2x)
Using identity, (x + y) (x – y) = x2 – y2
Here, x = 3 and y = 2x
(3 – 2x) (3 + 2x)
= 32 – (2x)2
= 9 – 4x2

JAC Class 9 Maths Solutions Chapter 2 Polynomials Ex 2.5

Question 2.
Evaluate the following products without multiplying directly:
(i) 103 × 107
(ii) 95 × 96
(iii) 104 × 96
Answer:
(i) 103 × 107
Answer:
(i) 103 × 107 = (100 + 3) (100 + 7)
Using identity, (x + a) (x + b)
= x2 + (a + b) x + ab
Here, x = 100, a = 3 and b = 7
103 × 107 = (100 + 3) (100 + 7)
= (100)2+ (3 + 7)100 + (3 × 7)
= 10000 + 1000 + 21 = 11021

(ii) 95 × 96 = (90 + 5) (90 + 6)
Using identity, (x + a) (x + b)
= x2 + (a + b) x + ab
Here, x = 90, a = 5 and b = 6
95 × 96 = (90 + 5) (90 + 6)
= 902 + 90(5 + 6) + (5 × 6)
= 8100 + (11 × 90) + 30 = 8100 + 990 + 30 = 9120

(iii) 104 × 96 = (100 + 4) (100 – 4)
Using identity, (x + y) (x – y) = x2 – y2
Here, x = 100 and y = 4
104 × 96 = (100 + 4) (100 – 4)
= (100)2 – (4)2
= 10000 – 16 = 9984

Question 3.
Factorise the following using appropriate identities:
(i) 9x2 + 6xy + y2
(ii) 4y2 – 4y + 1
(iii) x2 – \(\frac{y^2}{100}\)
Answer:
(i) 9x2 + 6xy + y2
= (3x)2 + (2 × 3x × y) + y2
Using identity, (a + b)2 = a2 + 2ab + b2
Here, a = 3x and b = y
9x2 + 6xy + y2
= (3x)2 + (2 × 3x × y) + y2
= (3x + y)2
= (3x + y) (3x + y)

(ii) 4y2 – 4y + 1
= (2y)2 – (2 × 2y × 1) + 12
Using identity, (a – b)2 = a2 – 2ab + b2
Here, a = 2y and b = 1
4y2 – 4y + 1
= (2y)2 – (2 × 2y × 1) + 12
= (2y – 1)2
= (2y – 1) (2y – 1)

(iii) x2 – \(\frac{y^2}{100}\) = x2– (\(\frac{y}{10}\))2
Using identity, a2 – b2= (a + b) (a – b)
Here, a = x and b = (\(\frac{y}{10}\))
x2 – \(\frac{y^2}{100}\) = x2 – (\(\frac{y^2}{100}\))2
= (x – \(\frac{y}{10}\)) (x + \(\frac{y}{10}\))

JAC Class 9 Maths Solutions Chapter 2 Polynomials Ex 2.5

Page – 49

Question 4.
Expand each of the following, using suitable identities:
(i) (x + 2y + 4z)2
(ii) (2x – y + z)2
(iii) (-2x + 3y + 2z)2
(iv) (3a – 7b – c)2
(v) (-2x + 5y – 3z)2
(vi) [\(\frac{1}{4}\) a – \(\frac{1}{2}\) b + 1]2
Answer:
(i) (x + 2y + 4z)2
Using identity, (a + b + c)2 = a2 + b2 + c2 + 2ab + 2bc + 2ca
Here, a = x, b = 2y and c = 4z
(x + 2y + 4z)2
= x2 + (2y)2 + (4z)2 + (2 × x × 2y) + (2 × 2y × 4z) + (2 × 4z × x)
= x2 + 4y2 + 16z2 + 4xy + 16yz + 8xz

(ii) (2x – y + z)2
Using identity, (a + b + c)2 = a2 + b2 + c2 + 2ab + 2bc + 2ca
Here, a = 2x, b = – y and c = z
(2x – y + z)2
= (2x)2 + (-y)2 + z2 + (2 × 2x × (- y)) + (2 × (- y) × z) + (2 × z × 2x)
= 4x2 + y2 + z2 – 4xy – 2yz + 4xz

(iii) (-2x + 3y + 2z)2
Using identity, (a + b + c)2 = a2 + b2 + c2 + 2ab + 2bc + 2ca
Here, a = – 2x, b = 3y and c = 2z
(-2x + 3y + 2z)2
=(-2x)2 + (3y)2 + (2z)2 + (2 × (- 2x) × 3y) + (2 × 3y × 2z) + (2 × 2z × (- 2x))
= 4x2 + 9y2 + 4z2 – 12xy + 12yz – 8xz

(iv) (3a – 7b – c)2
Using identity, (a + b + c)2 = a2 + b2+ c2 + 2ab + 2bc + 2ca
Here, a = 3a, b = – 7b and c = – c
(3a – 7b – c)2
= (3a)2 + (-7b)2 + (-c)2 + (2 × 3a × (-7b)) + (2 × (- 7b) × (- c)) + (2 × (- c) × 3a)
= 9a2 + 49b2 + c2 – 42ab + 14bc – 6ac

(v) (-2x + 5y – 3z)2
Using identity, (a + b + c)2 = a2 + b2 + c2 + 2ab + 2bc + 2ca
Here, a = – 2x, b = 5y and c = – 3z
(-2x + 5y – 3z)2
= (-2x)2 + (5y)2 + (-3z)2 + (2 × (-2x) × 5y) + (2 × 5y × (- 3z)) + (2 × (- 3z) × (- 2x))
= 4x2 + 25y2 + 9z2 – 20xy – 30yz + 12xz

(vi) [\(\frac{1}{4}\) a – \(\frac{1}{2}\) b + 1]2
Using identity, (a + b + c)2 = a2 + b2 + c2 + 2ab + 2bc + 2ca
Here, a = \(\frac{1}{4}\)a; b = \(\frac{1}{2}\) and c = 1
[\(\frac{1}{4}\) a – \(\frac{1}{2}\) b + 1]2
= \(\left(\frac{1}{4} \mathrm{a}\right)^2+\left(-\frac{1}{2} \mathrm{~b}\right)^2+1^2+\left(2 \times \frac{1}{4} \mathrm{a} \times \frac{(-1)}{2} \mathrm{~b}\right)+\left(2 \times \frac{(-1)}{2} \mathrm{~b} \times 1\right)+\left(2 \times 1 \times \frac{1}{4} \mathrm{a}\right)\)
= \(\frac{1}{16} \mathrm{a}^2+\frac{1}{4} \mathrm{~b}^2+1-\frac{1}{4} \mathrm{ab}-\mathrm{b}+\frac{1}{2} \mathrm{a}\)

JAC Class 9 Maths Solutions Chapter 2 Polynomials Ex 2.5

Question 5.
Factorise:
(i) 4x2 + 9y2 + 16z2 + 12xy – 24yz – 16xz
(ii) 2x2 + y2 + 8z2 – 2\( \sqrt{2} \)xy + 4 \( \sqrt{2} \) yz – 8xz
Answer:
(i) 4x2 + 9y2 + 16z2 + 12xy – 24yz -16xz
Using identity, (a + b + c)2 = a2 + b2 + c2 + 2ab + 2bc + 2ca
4x2 + 9y2 + 16z2 + 12xy – 24yz – 16xz
= (2x)2 + (3y)2 + (-4z)2 + (2 × 2x × 3y) + (2 × 3y × (- 4z)) + (2 × (- 4z) × 2x)
= (2x + 3y – 4z)2 = (2x + 3y – 4z) (2x + 3y – 4z)

(ii) 2x2 + y2 + 8z2 – 2 \( \sqrt{2} \) xy + 4 \( \sqrt{2} \) yz – 8xz
Using identity, (a + b + c)2 = a2 + b2 + c2 + 2ab + 2bc + 2ca
2×2 + y2 + 8z2 – 2 \( \sqrt{2} \) xy + 4 \( \sqrt{2} \) yz – 8xz
= (-\( \sqrt{2} \) x)2 + (y)2 + (2\( \sqrt{2} \)z)2 + (2 × (- \( \sqrt{2} \) x) × y) + (2 × y × 2 \( \sqrt{2} \) z) + (2 × 2\( \sqrt{2} \) z × (- \( \sqrt{2} \)x))
= (-V/2x + y+ 2>/2z)2 = (-V2x + y + 2 \( \sqrt{2} \) z) (- \( \sqrt{2} \) x + y + 2 \( \sqrt{2} \) z)

Question 6.
Write the following cubes in expanded form:
(i) (2x + 1)3
(ii) (2a – 3b)3
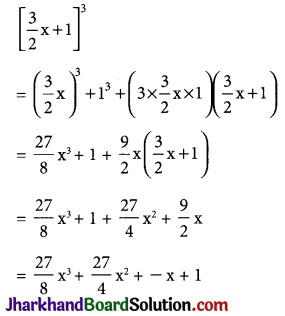
(iii) \(\left[\frac{3}{2} x+1\right]^3\)
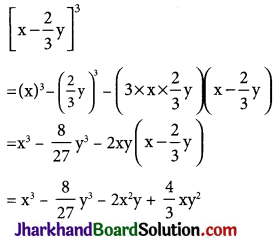
(iv) \(\left[x-\frac{2}{3} y\right]^3\)
Answer:
(i) (2x + 1)3
Using identity, (a + b)3 = a3 + b3 + 3ab(a + b)
(2x+1)3 = (2x)3 + 13 + (3 × 2x × 1)(2x + 1) = 8x3 + 1 + 6x(2x + 1)
= 8x3 + 12x2 + 6x + 1

(ii) (2a – 3b)3
Using identity, (a – b)3 = a3 – b3 – 3ab(a – b)
(2a – 3b)3
= (2a)3 – (3b)3 – (3 × 2a × 3b)(2a – 3b) = 8a3 – 27b3 – 18ab(2a – 3b)
= 8a3 – 27b3 – 36a2b + 54ab2

(iii) \(\left[\frac{3}{2} x+1\right]^3\)
Using identity, (a – b)3 = a3 – b3 – 3ab(a – b)
JAC Class 9 Maths Solutions Chapter 2 Polynomials Ex 2.5 - 1

(iv) \(\left[x-\frac{2}{3} y\right]^3\)
Using identity, (a – b)3 = a3 – b3 – 3ab(a – b)
JAC Class 9 Maths Solutions Chapter 2 Polynomials Ex 2.5 - 2

Question 7.
Evaluate the following using suitable identities:
(i) (99)3
(ii) (102)3
(iii) (998)3
Answer:
(i) (99)3 = (100 – 1)3
Using identity, (a – b)3 = a3 – b3 – 3ab(a – b)
(99)3 = (100 – 1)3
= (100)3 – (1)3 – (3 × 100 × 1) (100 – 1)
= 1000000 – 1 – 30000 + 300
= 970299

JAC Class 9 Maths Solutions Chapter 2 Polynomials Ex 2.5

(ii) (102)3 = (100 + 2)3
Using identity, (a – b)3 = a3 – b3 – 3ab(a – b)
(100 + 2)3
= (100)3 + (2)3 + (3 × 100 × 2) (100 + 2)
= 1000000 + 8 + 600 (100 + 2)
= 1000000 + 8 + 60000 + 1200
= 1061208

(iii) (998)3 = (1000 – 2)3
Using identity, (a – b)3 = a3 – b3 – 3ab(a – b)
= (1000)3 – (2)3 – (3 × 1000 × 2) (1000 – 2)
= 1000000000 – 8 – 6000 × (1000 – 2)
= 1000000000 – 8 – 6000000 + 12000
= 1000012000 – 6000008
= 994011992

Question 8.
Factorise each of the following:
(i) 8a3 + b3 + 12a2b + 6ab2
(ii) 8a3 – b3 – 12a2b + 6ab2
(iii) 27 – 125a3 – 135a + 225a2
(iv) 64a3 – 27b3 – 144a2b + 108ab2
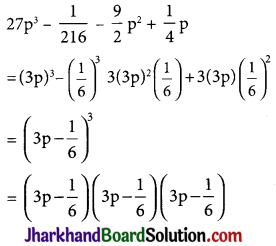
(v) 27p3 – \(\frac{1}{216}-\frac{9}{2}\)p2 + \(\frac {1}{4}\)p
Answer:
(i) 8a3 + b3 + 12a2b + 6ab2
Using identity, (a + b)3 = a3 + b3 + 3a2b + 3ab2
= (2a)3 + (b)3 + 3 (2a) (b) (2a + b)
= (2a + b)3
= (2a + b) (2a + b) (2a + b)

(ii) 8a3 – b3 – 12a2b + 6ab2
Using identity, (a + b)3 = a3 + b3 + 3a2b + 3ab2
= (2a)3 – (b)3 – 3 (2a)(b)(2a – b)
= (2a – b)3 = (2a – b)(2a – b)(2a – b)

(iii) 27 – 125a3 – 135a + 225a2
Using identity, (a + b)3 = a3 + b3 + 3a2b + 3ab2
= (3)3 – (5a)3 – 3(3)(5a) (3 – 5a)
= (3 – 5a)3 = (3 – 5a) (3 – 5a) (3 – 5a)

(iv) 64a3 – 27b3 – 144a2b + 108aba2
Using identity, (a + b)3 = a3 + b3 + 3a2b + 3ab2
= (4a)3 – (3b)3 – 3 (4a) (3b) (4a – 3b)
= (4a – 3b)3
= (4a – 3b) (4a – 3b) (4a – 3b)

(v) 27p3 – \(\frac{1}{216}-\frac{9}{2}\)p2 + \(\frac {1}{4}\)p
Using identity, (a + b)3 = a3 + b3 + 3a2b + 3ab2
JAC Class 9 Maths Solutions Chapter 2 Polynomials Ex 2.5 - 3

JAC Class 9 Maths Solutions Chapter 2 Polynomials Ex 2.5

Question 9.
Verify:
(i) x3 + y3 = (x + y) (x2 – xy + y2)
(ii) x3 – y3 = (x – y) (x2 + xy + y2)
Answer:
(i) (x + y) (x2 – xy + y2)
We know that,
(x + y)3 = x3 + y3 + 3xy(x + y)
⇒ x3 + y3 = (x + y)3 – 3xy(x + y)
⇒ x3 + y3 = (x + y)[(x + y)2 – 3xy] {Taking (x + y) common}
⇒ x3 + y3 = (x + y) (x2 + y2 – xy)
⇒ x3 + y3 = (x + y) (x2 + xy + y2)

(ii) x3 – y3 = (x – y) (x2 + xy + y2)
We know that,
(x – y)3 = x3 + y3 – 3xy(x – y)
⇒ x3 – y3 = (x – y)3 + 3xy(x – y)
⇒ x3 + y3 = (x – y)[(x – y)2 + 3xy] {Taking (x – y) common}
⇒ x3 + y3 = (x – y) [(x2 + y2 – 2xy) + 3xy]
⇒ x3 + y3 = (x + y)(x2 + y2 + xy)

Question 10.
Factorise each of the following:
(i) 27y3 + 125z3
(ii) 64m3 – 343n3
Answer:
(i) 27y3 + 125z3
Using identity, x3 + y3 = (x + y)(x2 + y2 + xy)
= (3y + 5z) [(3y)2 – 3y × 5z + (5z)2]
= (3y + 5z) [9y2 – 15yz + 25z2]

(ii) 64m3 – 343n3
Using identity, x3 + y3 = (x + y)(x2 + y2 + xy)
= (4m – 7n) [(4m)2 + 4m × 7n + (7n)2]
= (4m – 7n) [16m2 + 28mn + 49n2]

Question 11.
Factorise: 27x3 + y3 + z3 – 9xyz
Answer:
27x3 + y3 + z3 – 9xyz
= (3x)3 + y3 + z3 – 3 × (3x) yz
Using identity, x3 + y3 + z3 – 3xyz
= (x + y + z)(x2 + y2 + z2 – xy – yz – xz)
27x3 + y3 + z3 – 9xyz
= (3x + y + z) [(3x)2 + (y)2 + (z)2 – 3xy – yz – 3xz]
= (3x + y + z) (9x2 + y2 + z2 – 3xy – yz – 3xz)

Question 12.
Verify that: x3 + y3 + z3 – 3xyz = \(\frac {1}{2}\)(x + y + z) [(x – y)2 + (y – z)2 + (z – x)2]
Answer:
We know that,
x3 + y3 + z3 – 3xyz
= (x + y + z)(x2 + y2 + z2 – xy – yz – xz)
⇒ x3 + y3 + z3 – 3xyz
= \(\frac {1}{2}\) × (x + y + z) 2(x2 + y2+ z2 – xy – yz – xz)
= \(\frac {1}{2}\)(x + y + z)(2x2 + 2y2 + 2z2 – 2xy – 2yz – 2xz)
= \(\frac {1}{2}\)(x + y + z) [(x2 + y2 – 2xy) + (y2 + z2 – 2yz) + (x2 + z2 – 2xz)]
= \(\frac {1}{2}\)(x + y + z) [(x – y)2+ (y – z)2 + (z – x)2]

Question 13.
If x + y + z = 0, show that x3 + y3 + z3 = 3xyz.
Answer:
We know that,
x3 + y3 + z3
= (x2 + y2+ z2 – xy – yz – xz)
Now put (x + y + z) = 0,
(x2 + y2+ z2 – xy – yz – xz) – 3xyz = (0)(x2 + y2+ z2 – xy – yz – xz)
⇒ x3 + y3 + z3 = 3xyz

JAC Class 9 Maths Solutions Chapter 2 Polynomials Ex 2.5

Question 14.
Without actually calculating the cubes, find the value of each of the following:
(i) (-12)3 + (7)3 + (5)3
(ii) (28)3 + (-15)3 + (-13)3
Answer:
(i) (-12)3 + (7)3 + (5)3
Let x = – 12, y = 7 and z = 5
We observed that,
x + y + z = -12 + 7 + 5 = 0
We know that if, x + y + z = 0,
then x3 + y3 + z3 = 3xyz
(-12)3 + (7)3 + (5)3 = 3(-12)(7)(5)
= – 1260

(ii) (28)3 + (-15)3 + (-13)3
Let x = 28, y = – 15 and z = – 13
We observed that,
x + y + z = 28 – 15 – 13 = 0
We know that if, x + y + z = 0,
then x3 + y3 + z3 = 3xyz
(28)3 + (-15)3 + (-13)3
= 3(28)(-15)(-13) = 16380

Question 15.
Give possible expressions for the length and breadth of each of the following rectangles, in which their areas are given:
(i) Area: 25a2 – 35a +12
(ii) Area: 35y2 + 13y – 12
Answer:
(i) Area: 25a2 – 35a +12
Since, area is product of length and breadth therefore by factorising the given area, we can know the length and breadth of rectangle.
25a2 – 35a +12 = 25a2 – 15a – 20a + 12
= 5a(5a – 3) – 4(5a – 3) = (5a – 4) (5a -3 )
Possible expression for length = 5a – 3
Possible expression for breadth = 5a – 4

(ii) Area: 35y2 + 13y – 12
35y2 + 13y – 12 = 35y2 – 15y + 28y – 12
= 5y(7y – 3) + 4(7y – 3) = (5y + 4)(7y – 3)
Possible expression for length = (5y + 4)
Possible expression for breadth = (7y – 3)

JAC Class 9 Maths Solutions Chapter 2 Polynomials Ex 2.5

Page – 50

Question 16.
What are the possible expressions for the dimensions of the cuboids whose volumes are given below?
(i) Volume: 3x2 – 12x
(ii) Volume : 12ky2 + 8ky – 20k
Answer:
(i) Volume: 3x2 – 12x
Since, volume is product of length, breadth and height therefore by factorising the given volume, we can know the length, breadth and height of the cuboid.
3x2 – 12x = 3x(x – 4)
Possible expression for length = 3
Possible expression for breadth = x
Possible expression for height = (x – 4)

(ii) Volume : 12ky2 + 8ky – 20k
Since, volume is product of length, breadth and height therefore by factorising the given volume, we can know the length, breadth and height of the cuboid.
12ky2 + 8ky – 20k = 4k(3y2 + 2y – 5) = 4k(3y2 +5y – 3y – 5)
= 4k[y(3y + 5) – 1(3y + 5)]
= 4k (3y + 5) (y – 1)
Possible expression for length = 4k
Possible expression for breadth = (3y + 5)
Possible expression for height = (y – 1)

JAC Class 9 Maths Notes Chapter 14 Statistics

Students should go through these JAC Class 9 Maths Notes Chapter 14 Statistics will seemingly help to get a clear insight into all the important concepts.

JAC Board Class 9 Maths Notes Chapter 14 Statistics

Introduction:
The branch of science known as Statistics has been used in India from ancient times. Statistics deals with collection of numerical facts ie, data, their classification and tabulation and their interpretation. In statistics we shall try to study, in detail about collection, classification and tabulation of such data.
→ Importance of Data: Expressing facts with the helps of data is of great importance in our day-to-day life. For example, instead of saying that India has a large population it is more appropriate to say that the population of India, based on the census of 2001 is more than one billion.

→ Collection of Data: On the basis of methods of collection, data can be divided into two categories:
(i) Primary data: Data which are collected for the first time by the statistical investigator or with help of his workers is called primary data. For example if an investigator wants to study the condition of the workers working in a factory then for this he collects some data like their monthly income, expenditure, number of brothers, sisters, etc.

(ii) Secondary data: Data already collected by a person or a society and may be available in published or unpublished form is known as secondary data. Secondary should be carefully used. Such data is generally obtained from the following two sources.

  • Published sources
  • Unpublished sources

JAC Class 9 Maths Notes Chapter 14 Statistics

→ Classification of Data: When the data is compiled the same form and order in which it is collected, it is known as Raw Data. It is also called Crude Data. For example, the marks obtained by 20 students of class X in English out of 10 marks are as follow:
7. 4, 9, 5, 8, 9, 6, 7, 9, 2, 0 3, 7, 6, 2, 1, 9, 8, 3, 8
(i) Geographical basis: Here, the data is classified on the basis of place or region. For example, the production of food grains of different states is shown in the following table:

S. No. State Production (in Tons)
1 Andhra Pradesh 9690
2 Bihar 8074
3 Haryana 10065
4 Punjab 17065
5 Uttar Pradesh 28095

(ii) Chronological classification data’s classification is based on hour, day, week, month or year, then it is called chronological classification. For example, the population of India in different years is shown in following table:

S.No Year Production (in Crores)
1 1951 46.1
2 1961 53.9
3 1971 61.8
4 1981 68.5
5 1991 88.4
6 2001 100.01

(iii) Qualitative basis: When the data is classified into different groups on the basis of their descriptive qualities and properties such a classification is known as descriptive or qualitative classification. Since the attributes cannot be measured directly they are counted on the basis of presence or absence of qualities. For example intelligence, literacy, unemployment, honesty etc. The following table shows classification on the basis of sex and employment.

Population (in lacs)
Gender →
Position of Employment
Male Female
Employed 16.2 13.7
Unemployed 26.4 24.8
Total 42.6 38.5

(iv) Quantitative basis: If facts are such that they can be measured physically e.g, marks obtained, height, weight, age, income, expenditure etc, such facts are known as variable values. If such facts are kept into classes then it is called classification according to quantitative or class intervals.

Marks obtained 10 – 20 20 – 30 30 – 40 40 – 50
No. of students 7 9 15 6

JAC Class 9 Maths Notes Chapter 14 Statistics

Definitions:
→ Variate: The numerical quantity whose value varies is called a variate, generally a variate is represented by x. There are two types of variate.
(i) Discrete variate: Its magnitude is fixed. For example, the number of teachers in different branches of a institute are 30, 35, 40 etc.
(ii) Continuous variate: Its magnitude is not fixed. It is expressed in groups like 10 – 20, 20 – 30, … etc.
→ Range: The difference between the maximum and the minimum values of the variable x is called range.
→ Class frequency: in each class, the number of times a data is repeated is known as its class frequency.
→ Class limits: The lowest and the highest value of the class are known as lower and upper limits respectively of that class.
→ Classmark: The average of the lower and the upper limits of a class is called the mid value or the class mark of that class. It is generally denoted by x.
If x is the mid value and his the class size, then the class limits are \(\left(x-\frac{h}{2}, x+\frac{h}{2}\right)\).

Example:
The mid values of a distribution are 54, 64, 74, 84 and 94. Find the class size and class limits.
Solution:
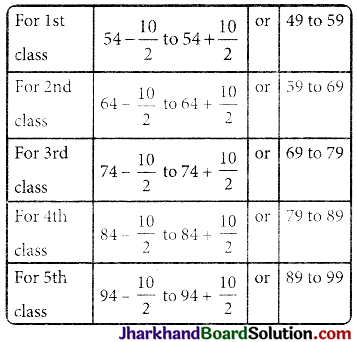
The class size is the difference of two consecutive class marks, therefore class size (h) = 64 – 54 = 10.
Here the mid values are given and the class size is 10. So, class limits are:
JAC Class 9 Maths Notes Chapter 14 Statistics 1
Therefore, class limits are 49 – 59, 59 – 69, 69 – 79, 79 – 89, and 89 – 99.

Frequency Distribution:
The marks scored by 30 students of IX class of a school in the first test of Mathematics out of 50 marks are as follows:
JAC Class 9 Maths Notes Chapter 14 Statistics 2
The number of times a mark is repeated is called its frequency. It is denoted by f.
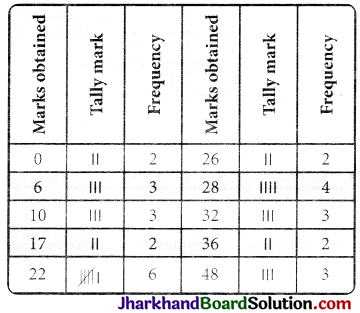
JAC Class 9 Maths Notes Chapter 14 Statistics 3
Above type of frequency distribution is called ungrouped frequency distribution. Although this representation of data is shorter than representation of raw data, but from the angle of comparison and analysis it is quite bit. So to reduce the frequency distribution, it can be classified into groups in following ways and it is called grouped frequency distribution.

Class Frequency
1 – 10 8
11 – 20 2
21 – 30 12
31 – 40 5
41 – 50 3

(a) Kinds of Frequency Distribution: Statistical methods like comparison, decision taken etc. depends on frequency distribution. Frequency distribution are of three types.
(i) Individual frequency distribution: Here each item or original price of unit is written separately. In this category, frequency of each variable is one.

Example:
Total marks obtained by 10 students in a class.

Marks obtained S. No.
46 1
18 2
79 3
12 4
97 5
80 6
5 7
27 8
67 9
54 10

(ii) Discrete frequency distribution: When number of terms is large and variable are discrete, i.e., variate can accept some particular values only under finite limits and is repeated then it is called discrete frequency distribution. For example, the wages of employees and their numbers is shown in following table.

Monthly wages No. of employees
4000 10
6000 8
8000 5
11000 7
20000 2
25000 1

The above table shows ungrouped frequency distribution and same facts can be written in grouped frequency as follows:

Monthly wages No. of employees
0 – 10,000 23
11,000 – 20,000 9
21,000 – 30,000 1

Note: If variable is repeated in individual distribution then it can be converted into discrete frequency distribution.
(iii) Continuous frequency distribution:
When number of terms is large and variate is continuous, i.e. variate can accept all values under finite limits and they are repeated then it is called continuous frequency distribution. For example age of students in a school is shown in the following table:

Age (in years) Class No. of students
Less than 5 years 0 – 51 72
Between 5 and 10 years 5 – 10 103
Between 10 and 15 years 10 – 15 50
Between 15 and 20 years 15 – 20 25

Classes can be made mainly by two methods:
(i) Exclusive series: In this method upper limit of the previous class and lower limit of the next class is same. In this method the value of upper limit in a class is not considered in the same class, it is considered in the next class.

(ii) Inclusive series: In this method value of upper and lower limit are both contained in same class. In this method the upper limit of class and lower limit of next class are not same. Some time the value is not a whole number, it is a fraction or in decimals and lies in between the two intervals then in such situation the class interval can be constructed as follows:

A B
Class Frequency Class Frequency
0 – 9 4 0 – 9.5 4
10 – 19 7 9.5 – 19.5 7
20 – 29 6 19.5 – 29.5 6
30 – 39 3 29.5 – 39.5 3
40 – 49 3 39.5 – 49.5 3

JAC Class 9 Maths Notes Chapter 14 Statistics

Cumulative Frequency:
→ Discrete frequency distribution:
From the table of discrete frequency distribution, it can be identified that number of employees whose monthly income is 4000 or how many employees of monthly income 11000 are there. But if we want to know how many employees whose monthly income is upto 11000, then we should add 10, 8, 5 and 7 i.e., number of employees whose monthly income is upto 11000 is 10 + 8 + 5 + 7 = 30. Here we add all previous frequency and get cumulative frequency. It will be more clear from the following table:

Income Frequency (f) Cumulative frequency (cf) Explanation
4000 10 10 10 = 10
6000 8 18 10 + 8
8000 5 23 18 + 5
11000 7 30 23 + 7
20000 2 32 30 + 2
25000 1 33 32 + 1

→ Continuous frequency distribution: In (a) part, we obtained cumulative frequency for discrete series. Similarly, cumulative frequency table can be made from continuous frequency distribution also.
For example, for table:

Monthly income No. of employees Cumulative Explanation
Variate (x) Frequency (F) Frequency (cf)
0 – 5 72 72 72 = 72
5 – 10 103 175 72 + 103 = 175
10 – 15 50 225 175 + 50 = 225
15 – 20 25 250 225 + 25 = 250

JAC Class 9 Maths Notes Chapter 14 Statistics

Graphical Representation Of Data:
(i) Bar graphs
(ii) Histograms
(iii) Frequency polygons
(iv) Frequency curves
(v) Cumulative frequency curves or Ogives
(vi) Pie Diagrams

(i) Bar Graphs. A bar graph is a graph that present categorical data with rectangular bars with heights or lengths proportional to the values that they represent.

Example:
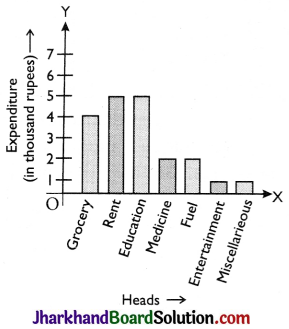
A family with monthly income of ₹ 20,000 had planned the following expenditure per month under various heads: Draw bar graph for the data giyen below:

Monthly income No. of employees Cumulative Explanation
Variate (x) Frequency (F) Frequency (cf)
0 – 5 72 72 72 = 72
5 – 10 103 175 72 + 103 = 175
10 – 15 50 225 175 + 50 = 225
15 – 20 25 250 225 + 25 = 250

Solution:
JAC Class 9 Maths Notes Chapter 14 Statistics 4
To draw a bar graph, class intervals are marked along x-axis on a suitable scale. Frequencies are marked along y-axis on a suitable scale, such that the areas of drawn rectangles are proportional to corresponding frequencies.

(ii) Histogram: Histogram is rectangular representation of grouped and continuous frequency distribution in which class intervals are taken as base and height of rectangles are proportional to corresponding frequencies.

Now we shall study construction of histo grams related with four different kinds of frequency distributions.

  • When frequency distribution is grouped and continuous and class intervals are also equal.
  • When frequency distribution is grouped and continuous but class interval are not equal.
  • When frequency distribution is grouped but not continuous.
  • When frequency distribution is ungrouped and middle points of the distribution are given.

Now we try to make the above facts clear with some examples.

Example:
Draw a histogram of the following frequency distribution.

Class (Age in year) 0 – 5 5 – 10 10 – 15 15 – 20
No. of students 72 103 50 25

Solution:
Here frequency distribution is grouped and continuous and class intervals are also equal. So mark the class intervals on the x-axis i.e., age in year (scale 1 cm = 5 year). Mark frequency i.e., number of students (scale 1 cm = 25 students) on the y-axis.
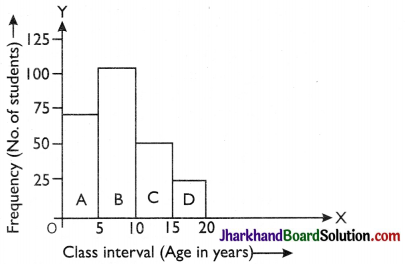
JAC Class 9 Maths Notes Chapter 14 Statistics 5

Example:
The weekly wages of workers of a factory are given in the following table. Draw histogram for it.

Weekly wages 1000 – 2000 2000 – 2500 2500 – 3000 3000 – 5000 5000 – 5500
No. of worker 26 30 20 16 1

Solution:
Here frequency distribution is grouped and continuous but class intervals are not same. Under such circumstances the following method is used to find heights of rectangle so that heights are proportional to frequencies the least.
(i) Write the least class size (h), here h = 500.
(ii) Redefine the frequencies of classes by using following formula.
Redefined frequency of class = \(\frac{\mathrm{h}}{\text { class size }}\) × frequency of class interval.
So, here the redefined frequency table is obtained as follows:

Weekly wages (in Rs.) No. of workers Redefined frequency of workers
1000 – 2000 26 500/1000 × 26 = 13
2000 – 2500 30 500/500 × 30 = 30
2500 – 3000 20 500/500 × 20 = 20
3000 – 5000 16 500/2000 × 16 = 4
5000 – 5500 1 500/500 × 1 = 1

Now mark class interval on x-axis (scale 1 cm = 500) and no of workers on y-axis (scale 1 cm = 5). On the basis of redefined frequency distribution, construct rectangles A, B, C, D and E.
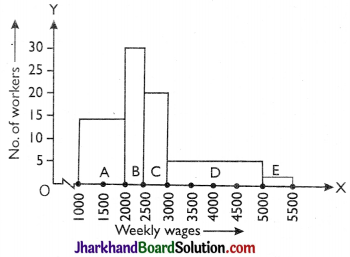
JAC Class 9 Maths Notes Chapter 14 Statistics 6
This is the required histogram of the given frequency distribution.

(a) Difference between Bar Graph and Histogram

  • In histogram there is no gap in between consecutive rectangles as in bar graph.
  • The width of the bar is significant in histogram. In bar graph, width is not important at all.
  • In histogram the areas of rectangles are proportional to the frequency, however if the class size of the classes are equal then heights of the rectangle are proportional to the frequencies.

(iii) Frequency polygon: A frequency polygon is also a form of a graphical representation of frequency distribution Frequency polygon can be constructed in two ways:

  • With the help of histogram.
  • Without the help of histogram.

Following procedure is useful to draw a frequency polygon with the help of histogram.

  • Construct the histogram for the given frequency distribution.
  • Find the middle point of each upper horizontal line of the rectangle.
  • Join these middle points of the successive rectangles by straight lines.
  • Join the middle point of the initial rectangle with the middle point of the previous expected class interval on the x-axis.
  • Join the middle point of the last rectangle with the middle point of the next expected class interval on the x-axis.

JAC Class 9 Maths Notes Chapter 14 Statistics

Example:
For the following frequency distribution, draw a histogram and construct a frequency polygon with it.

Class 20 – 30 30 – 40 40 – 50 50 – 60 60 – 70
Frequency 8 12 17 9 4

Solution:
The given frequency distribution is grouped and continuous, so we construct a histogram by the method given earlier Join the middle points P, Q, R, S, T of upper horizontal line of each rectangles A, B, C, D, E by straight lines.
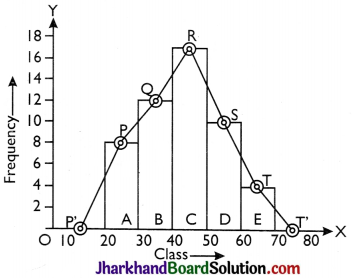
JAC Class 9 Maths Notes Chapter 14 Statistics 7

Example:
Draw a frequency polygon of the following frequency distribution table.

Marks obtained Frequency (No. of students)
0 – 10 8
10 – 20 10
20 – 30 6
30 – 40 7
40 – 50 9
50 – 60 8
60 – 70 8
70 – 80 6
80 – 90 3
90 – 100 4

Solution:
Given frequency distribution is grouped and continuous. So we construct a histogram by using earlier method. Join the middle points P, Q, R, S, T, U, V, W, X, Y of upper horizontal lines of each rectangle A, B, C, D, E, F, G, H, I, J by straight line in successions.
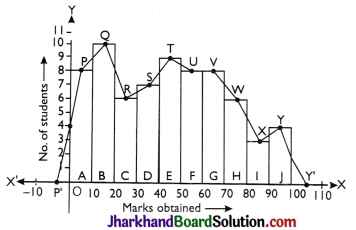
JAC Class 9 Maths Notes Chapter 14 Statistics 8

Example:
Draw a frequency polygon of the following frequency distribution.

Age (in years) Frequency
0 – 10 15
10 – 20 12
20 – 30 10
30 – 40 4
40 – 50 10
50 – 60 4

Solution:
Here frequency distribution is grouped and continuous so here we obtain following table on the basis of class.

Age (in years) Classmark Frequency
0 – 10 5 15
10 – 20 15 12
20 – 30 25 10
30 – 40 35 4
40 – 50 45 10
50 – 60 55 14

Now taking suitable scale on graph mark the points (5, 15), (15, 12), (25, 10) (35, 4), (45, 11), (55, 14).
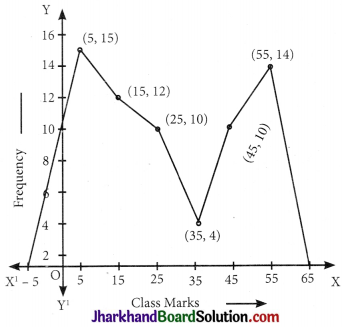
JAC Class 9 Maths Notes Chapter 14 Statistics 9

JAC Class 9 Maths Notes Chapter 14 Statistics

Measures Of Central Tendency:
The commonly used measure of central tendency are:
(a) Mean,
(b) Median,
(c) Mode

(a) Mean: The mean of a number of observations is the sum of the values of all the observations divided by the total number of observations. It is denoted by the symbol \(\overline{\mathrm{x}}\), read as x bar.
(i) Properties of mean:
→ If a constant real number ‘a’ is added to each of the observations, then new mean will be \(\overline{\mathrm{x}}\) + a.
→ If a constant real number ‘a’ is subtracted from each of the observations, then new mean will be \(\overline{\mathrm{x}}\) – a.
→ If a constant real number ‘a’ is multiplied with each of the observations, then new mean will be \(\overline{\mathrm{x}}\).
→ If each of the observation is divided by a constant no ‘a’ then new mean will be \(\frac{\overline{\mathrm{x}}}{\mathrm{a}}\).

(ii) Mean of ungrouped data: If x1, x2, x3, ….., xn are n values (or observations) then A.M. (Arithmetic mean) is
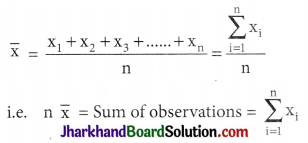
JAC Class 9 Maths Notes Chapter 14 Statistics 10
i.e. product of mean and no. of items gives sum of observations.

Example:
Find the mean of the factors of 10.
Solution:
Factors of 10 are 1, 2, 5 and 10.
\(\overline{\mathrm{x}}\) = \(\frac{1+2+5+10}{4}=\frac{18}{4}\) = 4.5

Example:
If the mean of 6, 4, 7, P and 10 is 8, find P.
Solution:
8 = \(\frac{6+4+7+P+10}{5}\)
⇒ P = 13

(iii) Method for Mean of ungrouped frequency distribution:

xi fi fixi
x1 f1 f1x1
x2 f2 f2x2
x3 f3 f3x3
· · ·
· · ·
xn fn fnxn
Σfi Σfixi

Then, mean \(\overline{\mathrm{x}}\) = \(\frac{\sum \mathrm{f}_{\mathrm{i}} \mathrm{x}_{\mathrm{i}}}{\sum \mathrm{f}_{\mathrm{i}}}\)

(iv) Method for Mean of grouped frequency distribution:
Example:
Direct Method: For finding mean

Marks No. of students (fi) Mid values (xi) fixi
10 – 20 6 15 9
20 – 30 8 25 200
30 – 40 13 35 455
40 – 50 7 45 315
50 – 60 3 55 165
60 – 70 2 65 130
70 – 80 1 75 75
Σfi = 40 Σfixi = 1430

\(\overline{\mathrm{x}}\) = \(\frac{\sum f_i x_i}{\sum f_i}=\frac{1430}{40}\) = 35.75

(v) Combined Mean:
\(\overline{\mathrm{x}}\) = \(\frac{\mathrm{n}_1 \overline{\mathrm{x}}_1+\mathrm{n}_2 \overline{\mathrm{x}}_2+\ldots \ldots .}{\mathrm{n}_1+\mathrm{n}_2+\ldots \ldots}\)

(vi) Uses of Arithmetic Mean

  • It is used for calculating average marks obtained by a student.
  • It is extensively used in practical statistics.
  • It is used to obtain estimates.
  • It is used by businessmen to find out profit per unit article, output per machine, average monthly income and expenditure etc.

(b) Median: Median of a distribution is the value of the variable which divides the distribution into two equal parts.
(i) Median of ungrouped data:

  • Arrange the data in ascending or descending order.
    Count the no. of observations (Let there be ‘n’ observations)
    If n is odd then median = value of \(\left(\frac{\mathrm{n}+1}{2}\right)^{\mathrm{th}}\) observation.
    If n is even then median = value of mean of \(\left(\frac{n}{2}\right)^{\text {th }}\) observation and \(\left(\frac{\mathrm{n}}{2}+1\right)^{\mathrm{th}}\) observation.

Example:
Find the median of the following values:
37, 31, 42, 43, 16, 25, 39, 45, 32
Solution:
Arranging the data in ascending order, we have
25, 31, 32, 37, 39, 42, 43, 45, 46
Here the number of observations, n
= 9 (odd)
∴ Median
= Value of \(\left(\frac{9+1}{2}\right)^{\text {th }}\) observation
= Value of 5th observation = 39.

Example:
The median of the observation 11, 12, 14, 18, x + 2, x + 4, 30, 32, 35, 41 arranged in ascending order is 24. Find the value of x.
Solution:
Here, the number of observations, n = 10.
Since n is even, therefore
Median
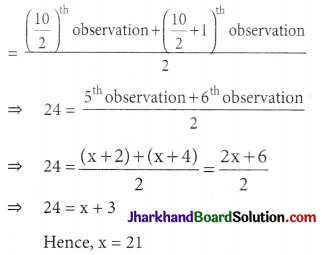
JAC Class 9 Maths Notes Chapter 14 Statistics 11

(ii) Uses of Median:
(A) Median is the only average to be used while dealing with qualitative data which cannot be measured quantitatively but can be arranged in ascending or descending order of magnitude.
(B) It is used for determining the typical value in problems concerning wages, distribution of wealth etc.

(c) Mode:
(i) Mode of ungrouped data (By inspection only): Arrange the data in an array and then count the frequencies of each variate. The variate having maximum frequency is the mode.

Example: Find the mode of the following array of an individual series of scores 7, 10, 12, 12, 12, 11, 13, 13, 17.

Number 7 10 11 12 13 17
Frequency 1 1 1 3 2 1

∴ Mode is 12
(ii) Uses of Mode: Mode is the average to be used to find the ideal size, e.g., in business forecasting, in manufacture of ready-made garments, shoes etc.

Empirical Relation Between Mode, Median And Mean:
Mode = 3 Median – 2 Mean
Range:
The range is the difference between the highest and lowest scores of a distribution. It is the simplest measure of dispersion. It gives a rough idea of dispersion. This measure is useful for ungrouped data.
(a) Coefficient of the Range:
If R and h are the lowest and highest scores in a distribution then the coefficient of the Range = \(\frac{\mathrm{h}-\mathrm{R}}{\mathrm{h}+\mathrm{R}}\)

Example: Find the range of the following distribution: 1, 3, 4, 7, 9, 10, 12, 13, 14, 16 and 19.
Solution:
R = 1, h = 19
∴ Range = h – R = 19 – 1 = 18.
JAC Class 9 Maths Solutions Chapter 4 Linear Equations in Two Variables Ex 4.4

Jharkhand Board JAC Class 9 Maths Solutions Chapter 4 Linear Equations in Two Variables Ex 4.4 Textbook Exercise Questions and Answers.

JAC Board Class 9th Maths Solutions Chapter 4 Linear Equations in Two Variables Ex 4.4

Page-77

Question 1.
Give the geometric representations of y = 3 as an equation
(i) in one variable
(ii) in two variables
Answer:
(i) In one variable, it is represented as y = 3
JAC Class 9 Maths Solutions Chapter 4 Linear Equations in Two Variables Ex 4.4 - 1

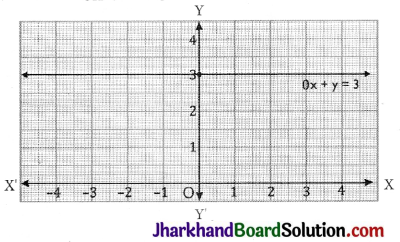
(ii) In two variables, it is represented as a line parallel to x-axis.
0x + y = 3
JAC Class 9 Maths Solutions Chapter 4 Linear Equations in Two Variables Ex 4.4 - 2

JAC Class 9 Maths Solutions Chapter 4 Linear Equations in Two Variables Ex 4.4

Question 2.
Give the geometric representations of 2x + 9 = 0 as an equation
(i) in one variable
(ii) in two variables
Answer:
(i) In one variable, it is represented as
JAC Class 9 Maths Solutions Chapter 4 Linear Equations in Two Variables Ex 4.4 - 3
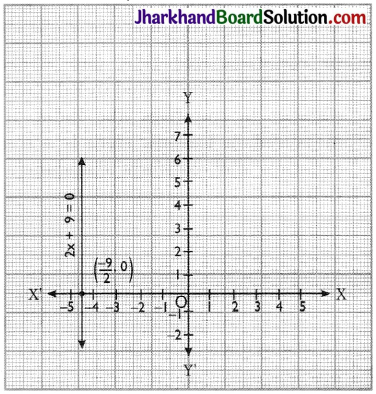
(ii) In two variables, it is represented as a line parallel to Y-axis.
2x + 0y + 9 = 0
JAC Class 9 Maths Solutions Chapter 4 Linear Equations in Two Variables Ex 4.4 - 4