Jharkhand Board JAC Class 9 Maths Solutions Chapter 14 Statistics Ex 14.2 Textbook Exercise Questions and Answers.
JAC Board Class 9th Maths Solutions Chapter 14 Statistics Ex 14.2
Page-245
Question 1.
The blood groups of 30 students of Class VIII are recorded as follows:
A, B, O, O, AB, O, A, O, B, A, O, B, A, O, O
A, AB, O, A, A, O, O, AB, B, A, O, B, A, B, O.
Represent this data in the form of a frequency distribution table. Which is the most common, and which is the rarest, blood group among these students?
Answer:
The frequency means the number of students having same blood group. We will represent the data in table:
| Blood Group | Number of Students (Frequency) |
| A | 9 |
| B | 6 |
| O | 12 |
| AB | 3 |
| Total | 30 |
Most common Blood Group (Highest frequency): O
Rarest Blood Group (Lowest frequency): AB
Question 2.
The distance (in km) of 40 engineers from their residence to their place of work w ere found as follows:
| 5 | 3 | 10 | 20 | 25 |
| 11 | 13 | 7 | 12 | 31 |
| 19 | 10 | 12 | 17 | 18 |
| 11 | 32 | 17 | 16 | 2 |
| 7 | 9 | 7 | 8 | 3 |
| 5 | 12 | 15 | 18 | 3 |
| 12 | 14 | 2 | 9 | 6 |
| 15 | 15 | 7 | 6 | 12 |
Construct a grouped frequency distribution table with class size 5 for the data given above taking the first interval as 0-5 (5 not included). What main features do you observe from this tabular representation?
Answer:
The given data is very large. So, we con-struct a group frequency of class size 5. Therefore, class interval will be 0-5, 5-10, 10-15, 15-20 and so on. The data is represented in the table as:
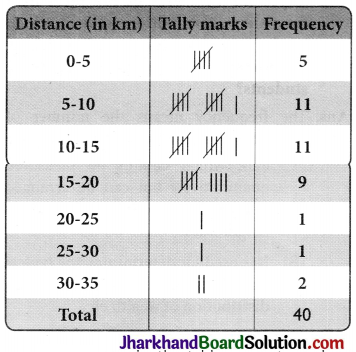
The classes in the table are not overlap¬ping. Also, 36 out of 40 engineers have their house below 7. 20 km of distance.
Question 3.
The relative humidity (in %) of a certain city for follows: a month of 30 days was as
| 98.1 | 98.6 | 99.2 | 90.3 | 86.5 |
| 95.3 | 92.9 | 96.3 | 94.2 | 95.1 |
| 89.2 | 92.3 | 97.1 | 93.5 | 92.7 |
| 95.1 | 97.2 | 93.3 | 95.2 | 97.3 |
| 96.2 | 92.1 | 84.9 | 90.2 | 95.7 |
| 98.3 | 97.3 | 96.1 | 92.1 | 89 |
(i) Construct a grouped frequency distribution table with classes 84 – 86, 86 – 88, etc.
(ii) Which month or season do you think this data is about?
(iii) What is the range of this data?
Answer:
(i) The given data is very large. So, we construct a group frequency of class size 2. Therefore, class interval will be 84-86, 86-88, 88-90, 90-92 and so on. The data is represented in the table as below:
| Relative humidity (in %) | Frequency |
| 84-86 | 1 |
| 86-88 | 1 |
| 88-90 | 2 |
| 90-92 | 2 |
| 84-86 | 1 |
| 86-88 | 1 |
| 88-90 | 2 |
| 90-92 | 2 |
| 92-94 | 7 |
| 94-96 | 6 |
| 96-98 | 7 |
| 98-100 | 4 |
| Total | 30 |
(ii) The humidity is very high in the data which is observed during rainy season. So, it must be rainy season.
(iii) Range of data = Maximum value of data – Minimum value of data = 99.2 – 84.9 = 14.3%
![]()
Question 4.
The heights of 50 students, measured to the nearest centimetres, have been found to be as follows:
| 161 | 150 | 154 | 165 | 168 |
| 161 | 154 | 162 | 150 | 151 |
| 162 | 164 | 171 | 165 | 158 |
| 154 | 156 | 172 | 160 | 170 |
| 153 | 159 | 161 | 170 | 162 |
| 165 | 166 | 168 | 165 | 164 |
| 154 | 152 | 153 | 156 | 158 |
| 162 | 160 | 161 | 173 | 166 |
| 161 | 159 | 162 | 167 | 168 |
| 159 | 158 | 153 | 154 | 159 |
(i) Represent the data given above by a grouped frequency distribution table, taking the class intervals as 150-155,155-160, etc. soon.
(ii) What can you conclude about their heights from the table?
Answer:
(i) The data with class interval 150-155, 155-160 and so on is represented in the table as:
| Height (in cm) | No. of Students (Frequency) |
| 150-155 | 12 |
| 155-160 | 9 |
| 160-165 | 14 |
| 165-170 | 10 |
| 170-175 | 5 |
| Total | 50 |
(ii) From the given data, it can be concluded that 35 students i.e. more than 50% are shorter than 165 cm.
Question 5.
A study was conducted to find out the concentration of sulphur dioxide in the air in parts per million (ppm) of a certain city. The data obtained for 30 days is as follows:
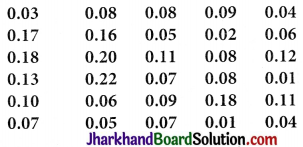
(i) Make a grouped frequency distribution table for this data with class intervals as 0.00-0.04, 0.04-0.08, and so on.
(ii) For how many days, was the concentration of sulphur dioxide more than 0.11 parts per million?
Answer:
(i) The data with class interval 0.00 – 0.04, 0.04 – 0.08 and so on is represented in the table as:
| Concentration of sulphur dioxide in air (in ppm) | Frequency |
| 0.00 – 0.04 | 4 |
| 0.04 – 0.08 | 9 |
| 0.08 – 0.12 | 9 |
| 0.12-0.16 | 2 |
| 0.16-0.20 | 4 |
| 0.20 – 0.24 | 2 |
| Total | 30 |
(ii) 2 + 4 + 2 = 8 days have the concentration of sulphur dioxide more than 0.11 parts per million.
Page-246
Question 6.
Three coins were tossed 30 times simultaneously. Each time the number of heads occurring was noted down as follows:
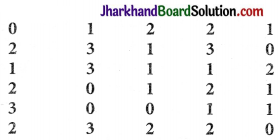
Prepare a frequency distribution table for the data given above.
Answer:
The frequency distribution table for the data given above can be prepared as follows:
| Number of Heads | Frequency |
| 0 | 6 |
| 1 | 10 |
| 2 | 9 |
| 3 | 5 |
| Total | 30 |
![]()
Question 7.
The value of π upto 50 decimal places is given below:
3.14159265358979323846264338327950288419716939937510
(i) Make a frequency distribution of the digits from 0 to 9 after the decimal point.
(ii) What are the most and the least frequently occurring digits?
Answer:
(i) The frequency is given as follows:
| Digits | Frequency |
| 0 | 2 |
| 1 | 5 |
| 2 | 5 |
| 3 | 8 |
| 4 | 4 |
| 5 | 5 |
| 6 | 4 |
| 7 | 4 |
| 8 | 5 |
| 9 | 8 |
| Total | 50 |
(ii) The digit having the least frequency occurs the least and the digit with highest frequency occurs the most. 0 has frequency 2 and thus occurs least frequently while 3 and 9 have frequency 8 and thus occur most frequently.
Question 8.
Thirty children were asked about the number of hours they watched TV programmes in the previous week. The results were found as follows:
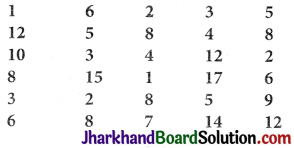
(i) Make a grouped frequency distribution table for this data, taking class width 5 and one of the class intervals as 5-10.
(ii) How many children watched television for 15 or more hours a week?
Answer:
(i) The distribution table for the given data, taking class width 5 and one of the class intervals as 5-10 is as follows:
| Number of Hours | Frequency |
| 0 – 5 | 10 |
| 5 – 10 | 13 |
| 10 – 15 | 5 |
| 15 – 20 | 2 |
| Total | 30 |
(ii) We observed from the given table that 2 children watched television for 15 or more hours a week.
Question 9.
A company manufactures car batteries of a particular type. The lives (in years) of 40 such batteries were recorded as follows:
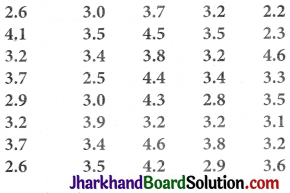
Construct a grouped frequency distribution table for this data, using class intervals of size 0.5 starting from the interval 2-2.5.
Answer:
A grouped frequency distribution table using class intervals of size 0.5 starting from the interval 2-2.5 is constructed.
| Lives of batteries (in years) | No. of batteries (Frequency) |
| 2 – 2.5 | 2 |
| 2.5 – 3 | 6 |
| 3 – 3.5 | 14 |
| 3.5 – 4 | 11 |
| 4 – 4.5 | 4 |
| 4.5 – 5 | 3 |
| Total | 40 |