JAC Board Class 9th Social Science Solutions Economics Chapter 3 Poverty as a Challenge
JAC Class 9th Economics Poverty as a Challenge InText Questions and Answers
Page No. 32
Question 1.
Why do different countries use different poverty lines?
Answer:
Different countries use different poverty lines because what is necessary to satisfy basic needs is different at different times and in different countries. Each country uses an imaginary line that is considered appropriate for its existing level of development and its accepted minimum social norms.
![]()
Question 2.
What do you think would be the “minimum necessary level” in your locality?
Answer:
The “minimum necessary level” in our locality would be ₹5000 per month per head.
Page No. 33
Table 3.1 Estimates of Poverty in India
| Poverty Ratio (%) | Number of Poor (in million) | |||||
| Year | Rural | Urban | Total | Rural | Urban | Combined |
| 1993-94 | 50.7 | 32 | 45 | 329 | 75 | 404 |
| 2004-05 | 42 | 26 | 37 | 326 | 81 | 407 |
| 2009-10 | 34 | 21 | 30 | 278 | 76 | 355 |
| 2011-12 | 26 | 14 | 22 | 217 | 53 | 270 |
(Source Economic Survey 2017-18.)
Question 1.
Even if poverty ratio declined between 1993-94 and 2004-05, why did the number of poor remain at about 407 million?
Answer:
Though poverty ratio declined between 1993-94 and 2004-05, the number of poor remained at about 407 million due to population explosion during this period.
Question 2.
Are the dynamics of poverty reduction the same in rural and urban India?
Answer:
No, the dynamics of poverty reduction are not the same in rural and urban India.
Page. No. 35
Observe some of the poor families around you and try to find the following:
Question 1.
Which social and economic group do they belong to?
Answer:
They belong to scheduled castes and scheduled tribes and some are daily wages labourers.
![]()
Question 2.
Who are the earning members in the family?
Answer:
Both males and females are the earning members in the family.
Question 3.
What is the condition of the old people in the family?
Answer:
The condition of the old people in the family is very bad. They are treated as a burden on the family.
Question 4.
Are all the children (boys and girls) attending schools?
Answer:
No, all the children (boys and girls) are not attending schools. Only some boys are attending schools while girls are made to sit at home.
Page. No. 36
Graph 3.2 : Poverty Ratio in Selected Indian States (As per 2011 census)
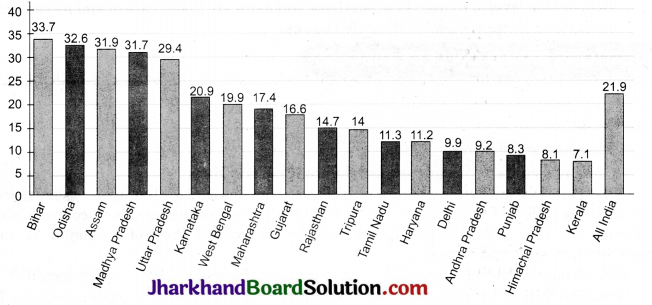
[Source Economic Survey 2017-18
Study the Graph 3.2 and do the following:
Question 1.
Identify the three states where the poverty ratio is the highest.
Answer:
- Bihar.
- Odisha.
- Assam.
Question 2.
Identify the three states where poverty ratio is the lowest.
Answer:
- Kerela.
- Himachal Pradesh.
- Punjab.
Page. No. 36
Graph 3.4 Number of the poor by region ($ 1.90 per day) in millions
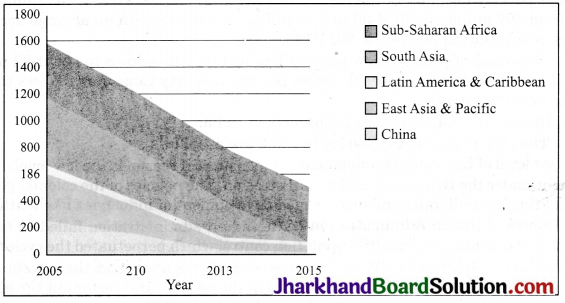
(Source Poverty and Equity Database: Word Bank (http://databank.worldbank.org/data/ reports. aspx?source=poverty-and-equity-database)
Study the Graph 3.4 and do the following:
Question 1.
Identify the areas of the world, where poverty ratios have declined.
Answer:
Poverty ratios have declined in:
- East Asia and Pacific,
- China,
- Sub-Saharan Africa,
- South Asia.
![]()
Question 2.
Identify the area of the globe which has the largest concentration of the poor.
Answer:
East Asia and the Pacific has the largest concentration of the poor.
JAC Class 9th Economics Poverty as a Challenge Textbook Questions and Answers
Question 1.
Describe how the poverty line is estimated in India?
Answer:
A common method used to measure poverty is based on the income or consumption levels. A minimum level of food requirement, clothing, footwear, fuel and light, educational anu medical requirement, etc. are determined for subsistence while determining the poverty line in India. These physical quantities are multiplied by their prices in rupees.
The present formula for food requirement while estimating the poverty line is based on the desired calorie requirement. The accepted average calorie requirement in India is 2400 calories per person per day in rural areas and 2100 calories per person per day in urban areas.
Question 2.
Do you think that present methodology of poverty estimation is appropriate?
Answer:
No, we do not think that the present methodology of poverty estimation is appropriate. The present methodology of poverty estimation takes into consideration income and consumption level only. That is insufficient criterion. According to social scientists, poverty should be a looked at through some other indicators. These indicators may be lack of general resistance due to continuous malnutrition, lack of access to healthcare, lack of job opportunities, lack of access to safe drinking water and sanitation, etc. Poverty should also be viewed on the basis of social exclusion and vulnerability.
Question 3.
Describe poverty trends in India since 1973.
Answer:
There has been a substantial decline in poverty ratios in India. It was about 55 per cent in 1973-74, which reduced to 37 per cent in 2004-05. Although, the percentage of people living under poverty declined in the earlier two decades, i.e., 1973-1993, the number of poor declined from 407 million in 2004-05 to 270 million in 2011-12 with an average decline of 2.2 percentage points during 2004-05 to 2011-12.
The proportion of people below poverty line further came down to about 22 per cent in 2011-12. If the trend continues, people below poverty line may came down to less than 20 per cent in the next few years.
Question 4.
Discuss the major reasons for poverty in India.
Answer:
The major reasons for poverty in India are as follows:
1. Low level of Economic Development:
One historical reason is the low level of economic development under the British colonial administration. The policies of the colonial government ruined traditional handicrafts and discouraged development of industries like textiles.
2. Failure of Indian Administration:
The Indian administration failed at two fronts :
(i) Promotion of economic growth,
(ii) Population control which perpetuated the cycle of poverty.
3. Lack of Employment:
With the extension of irrigation and the advents of Green Revolution, many job opportunities were created in the agricultural sector but the effects were limited to some parts of India. The industries, both in the public and private sector did provide some jobs. But there were not enough to absorb all the job seekers.
4. Huge Income Inequalities:
This is one of the major reasons of poverty in India. Unequal distribution of land and other resources increases income inequalities.
![]()
Question 5.
Identify the social and economic groups which are most vulnerable to poverty in India.
Answer:
1. Social Groups:
The social groups more vulnerable to poverty are the scheduled caste and scheduled tribe households. These are not allowed to avail the facilities given to others due to the prevailing caste system. This leads to poverty.
2. Economic Groups:
The economic groups vulnerable to poverty are the rural agricultural labourer households and the urban casual labourer households. The rural agricultural labourers have no land of their own and are thus not able to earn enough to meet their daily needs, and hence remain poor.
Question 6.
Give an account of inter-state disparities of poverty in India.
Answer:
A major aspect of poverty in India is that the proportion of poor people is not the same in every state. The success rate of reducing poverty varies from state to state. Recent estimates show while the all India Head Count Ratio (HCR) was 21.9 per cent in 2011-12 states like Madhya Pradesh, Assam, Uttar Pardesh, Bihar and Odisha had higher poverty levels than the all, India poverty level. Bihar and Odisha continue to be the two poorest states with poverty ratios of 33.7 and 32.6 per cent respectively.
Along with rural poverty, urban poverty is also high in Odisha, Madhya Pradesh, Bihar and Uttar Pradesh. In comparison, there has been a significant decline in poverty in Kerala, Maharashtra, Andhra Pradesh, Tamil Nadu, Gujarat and West Bengal.
States like Punjab and Haryana have traditionally succeeded in reducing poverty with the help of high agricultural growth rates. Kerala with the help of human resource development, West Bengal with land reform measures, Andhra Pradesh and Tamil Nadu with Public distribution of food grains have been successful in reducing poverty levels.
![]()
Question 7.
Describe global poverty trends.
Answer:
The proportion of people in developing countries living in extreme economic poverty has fallen from 36 per cent in 1990 to 10 per cent in 2015. Although, there has been a substantial reduction in global poverty, it is marked with great regional differences.
Poverty declined substantially in China and South-East Asian countries as a result of rapid economic growth and massive investments in human resource development. Number of poor in China has come down from 88.3 per cent in 1981 to 14.7% per cent in 2008, and to 0.7 percent in 2015.
In the countries of South Asia (India, Pakistan, Sri Lanka, Nepal, Bangladesh, Bhutan), the decline has also been rapid-34 percent in 2005 to 16.2 percent in 2013. In Sub-Saharan Africa, poverty in fact declined from 51 per cent in 2005 to 41 per cent in 2015. In Latin America, the ratio of poverty has also declined from 10 percent in 2005 to 4 percent in 2015. Poverty has also resurfaced in some of the former socialist countries like Russia where officially it was non-existent earlier.
Question 8.
Describe the current government strategy of poverty allevaition.
Answer:
Removal of poverty has been one of the major objectives of Indian developmental strategy. The current anti-poverty strategy of the government is based broadly on two planks:
1. Promotion of Economic Growth:
Over a period of thirty years lasting upto the early eighties, there was little per capita income growth and not much reduction in poverty. Official poverty estimates which were about 45 percent in the early 1950s remained the same even in the early eighties.
Since the eighties, India’s economic growth has been one of the fastest in the world. The growth rate jumped from the average of about 3.5 per cent a year in the 1970s to about 6 per cent during the 1980s and 1990s. The higher growth rates have helped significantly in the reduction of poverty.
Therefore, it is becoming clear that there is a strong link between economic growth and poverty reduction. Economic growth widens opportunities and provides the resources needed to invest in human development. However, the poor may not be able to take direct advantage of the opportunities created by economic growth. Moreover, growth in the agriculture sector is much below the expectations.
2. Targetted Anti-poverty Programmes:
There is a clear need for targetted anti-poverty programmes. The government has implemented several anti- poverty schemes to eradicate poverty; Some of these are as follows :
(a) National Rural Employment Guarantee Act (NREG), 2005
(b) Prime Minister Rozgar Yojana (PMRY), 1993
(c) Rural Employment Generation Programme (REGP), 1995
(d) Swamajayanti Gram Swarozgar Yojana (SGSY), 1999
(e) Pradhan Mantri Gramodaya Yojana (PMGY), 2000
(f) Antyodaya Anna Yojana (AAY), 2000
![]()
Question 9.
Answer the following questions briefly:
1. What do you understand by human poverty?
Answer:
Human poverty is a concept that goes beyond the limited view of poverty as lack of income. It refers to the denial of political, economic and social opportunities to an individual, needed to maintain a reasonable standard of living. Illiteracy, lack of job opportunities, lack of access to proper healthcare and sanitation, caste and gender discrimination, etc are all components of human poverty.
2. Who are the poorest of the poor?
Answer:
Women, elderly people and female infants are the poorest of the poor in society Women, elderly people and the girl child are systematically denied equal access to the resources available in the family. That is why they are considered as the poorest of the poor.
3. What are the main features the National Rural Employment Guarantee Act, 2005?
Answer:
National Rural Employment Guarantee Act, 2005 was passed in September 2005.
Its main features are as under:
- The Act provides 100 days assured employment every year to every rural household.
- One-third of the proposed jobs would be reserved for women.
- Under the programme, if an applicant is not provided employment within fifteen days he/she will be entitled to get daily unemployment allowance.
- The central government and state governments will establish National Employment Guarantee Funds and State Employment Guarantee Funds respectively.